
(Updated in November 2021)
Define the way you quantify your mixtures analysis:
The way the spectral integrals are converted into meaningful, quantitative information in SMA is determined by the person setting up the analysis. The formula for determining the concentration is specified within the ‘Compound Formula’ panel of the SMA mixture editor. The Compound Formula definition comes with three hard coded formulae. These formulae are the standard definitions for Concentration, Mass % and Purity. They will automatically be generated based on the multiplet integral regions that you specify for the compound. When you select one of these equations the entire equation will automatically populate into SMA, including averaging if more than one spectral region is specified. SMA even takes care of including the mass of any reference materials and can be used with 1D and 2D datasets.
Flexibility to define your own way!
SMA goes way beyond enabling quantification using standard methods and equations – it’s so much more powerful than that! We know that there can often be empirical relationships between different components in mixtures. For example, Guillen and Ruiz have determined an empirical relationship to quantify Oleic, Linoleic and Linolenic acids, as well as the degree of saturation of acyl groups in olive oil samples (Guillén, 2003). SMA enables this method to easily and quickly be implemented, and therefore applied to multiple olive oil samples reproducibly and reliably with no need to perform calculations manually. Any equation to convert peak integrals into concentrations can be specified; the equations can be anything at all, from the simple ones we have in this example to complex and exotic relationships!
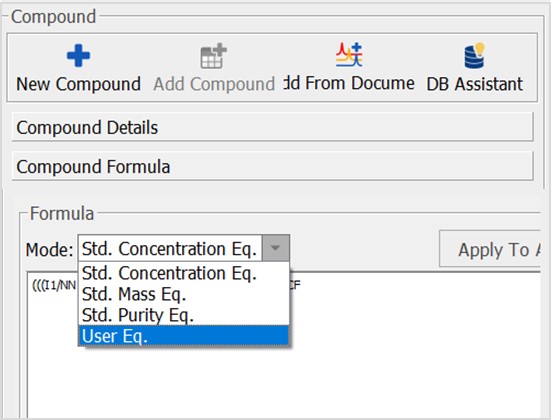
To define your own equation, you just need to select ‘User Equation’ in the Compound Formula panel and then use the Equation Editor to define all the parameters for your concentration determination equation and define the equation itself.
Specify the calculation of a concentration
The Equation Editor allows you to take integral data obtained from the spectra and use them directly in equations, but you can also take concentrations of other components in the mixture – for example concentrations determined using the standard equations – and use those concentrations within the Equation Editor to calculate the concentration of additional components. That’s what we are doing in the example below.
We have recreated the olive oil analysis of Guillen and Ruiz. First, we screen the NMR spectrum of the sample to generate integrals of the proscribed peaks which are required for the concentration determination.
An example spectrum is shown in Figure 1, with the selected peaks identified.
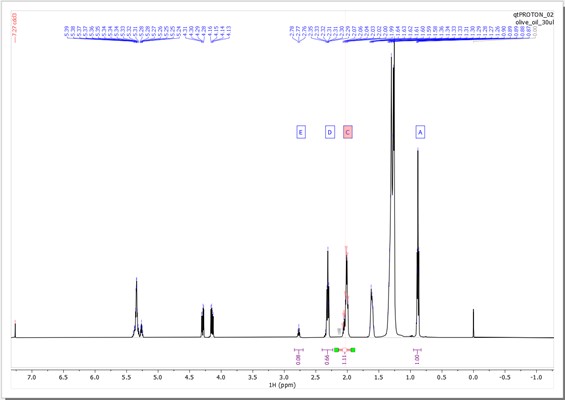
Figure 1: NMR spectrum of olive oil. Integrals marked are used for the determination of fatty acid concentration and degree of unsaturation
The concentration determination is done according to the following equations:
% Linoleic Acid=B/(A+B)*100
% Linolenic Acid= (E/D-2 B/(A+B))*100
% Oleic Acid= (C/2D-E/D+B/(A+B))*100
% Saturation=(1-C/2D)*100
These equations can be transcribed into a user defined equation using the Formula Editor then saved and reused as part of the SMA workflow. An example showing the formula for calculation of Linolenic Acid is shown in Figure 2.

Figure 2: Specifying how the concentration of Linoleic Acid in olive oil using the Formula Editor in SMA.
The results of creating this assay and applying it to the NMR spectrum shown in Figure 1 are shown in Figure 3.

Figure 3: The results of using a user defined equation to calculate the concentration of fatty acids in olive oil samples.
The equation editor even includes advanced math’s functions to help you quickly and easily type your equations without making mistakes. An overview of the advanced math’s interface is shown in Figure 4. It is powerful enough that you can check the formula you have typed for errors. The equation editor accommodates user defined parameters, constants, concentration conversion factors and much more as well as including a predefined list of variables that are commonly used in concentration determinations.

Figure 4: The tools for quickly and easily defining formulae in SMA, including the capability to request statistics and define customer parameters.
Creating custom equations in SMA is as easy as typing this blog post! All you have to do is type in the equations to use and you are ready to analyze many samples and have more time to spend acquiring data and doing the other tasks you love more than making mistakes while transcribing integrals from acquisition programs to spreadsheets to calculate concentrations. What’s cooler than that…?
Perhaps being able to run multiple mixture analyses on different sample matrices, automatically, in batches or in real time as soon as the spectrometer acquires the data would be even more cool – Sleep easy, that is possible too, we’ll show you how in another blog post coming soon!
References
Guillén, M. a. (2003). Rapid simultaneous determination by proton NMR of unsaturation and composition of acyl groups in vegetable oils. . Eur. J. Lipid Sci. Technol., 105, 688-696. Retrieved from https://doi.org/10.1002/ejlt.200300866


