
(Updated on December 9th, 2021)
Running Predictions
Import a molecular structure. Currently, molecular structures can be imported as a .mol file by simply using the Open command exactly in the same way as it would be applied to a spectrum. Bear in mind, that you are currently able to copy&paste .cdx structures from ChemDraw and .mol from IsisDraw but not drag&drop them. Support to 'drag & drop' operations are currently limited to ChemSketch.
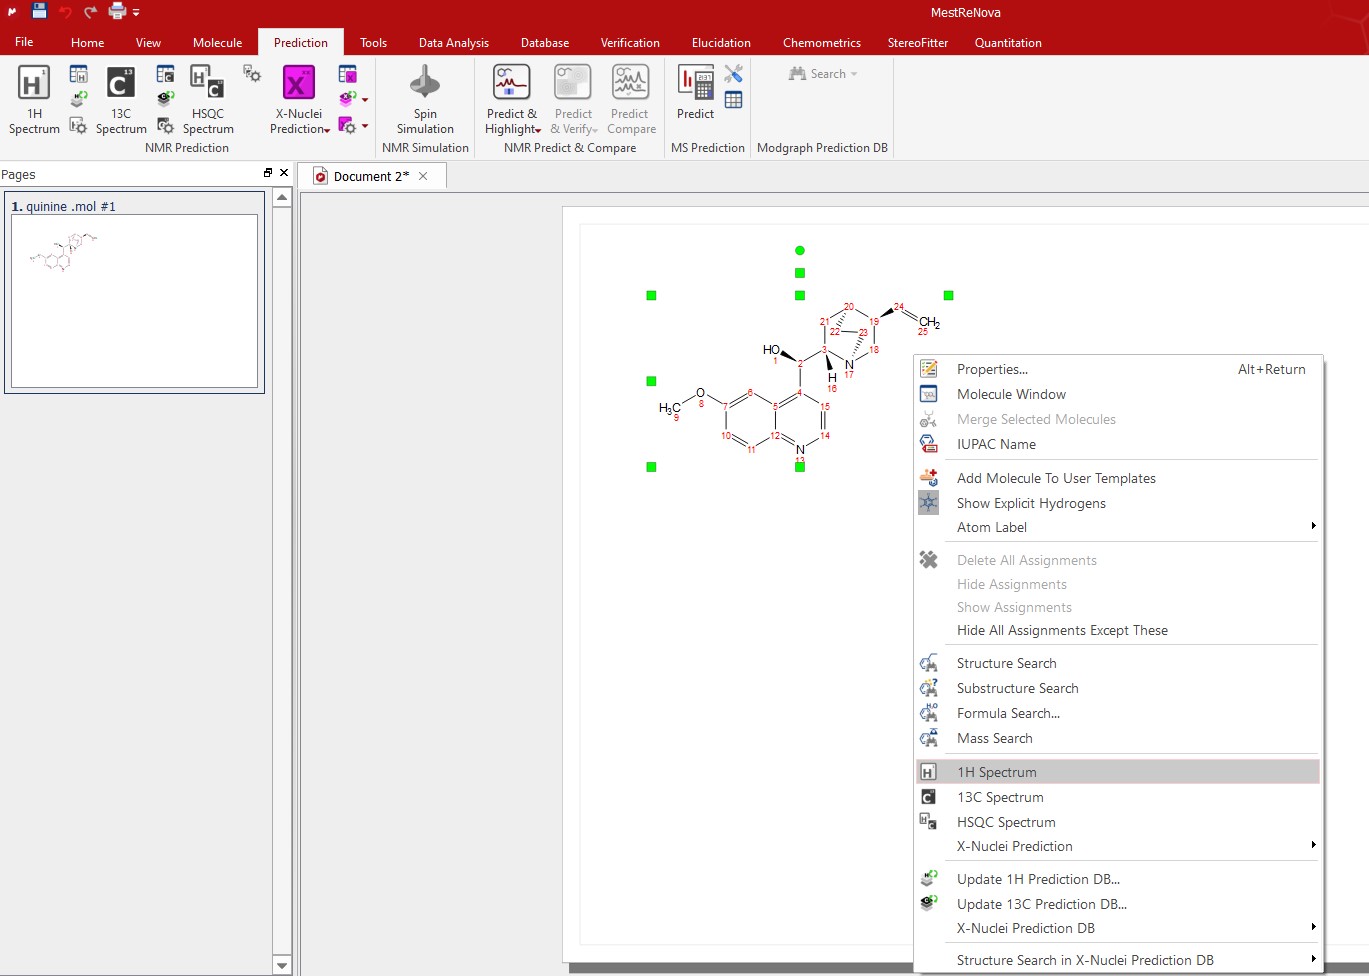
Right click on the molecule structure and select 'Predict Spectrum' (1H, 13C, 31P, 19F, 15N, 17O, 29Si).
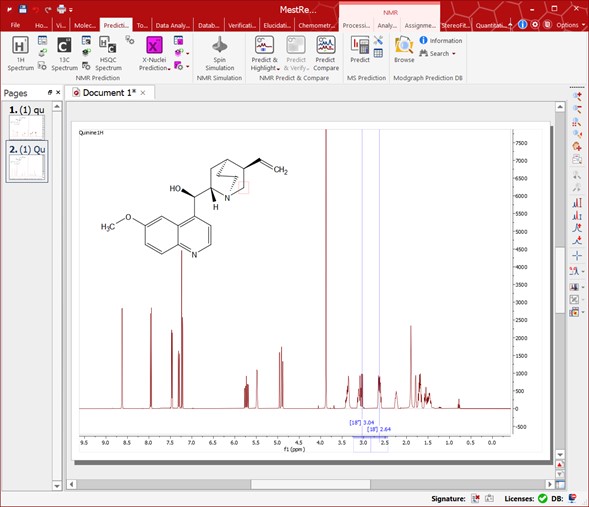
Then you will obtain the desired predicted spectrum as shown below:

The spectrum can be analyzed as a real one (e.g. it can be integrated, peak picking, etc).

If you don't display the atom numbers and still want to know which peak belongs to which atom, just hover the mouse over the desired atom, (so that it becomes highlighted in a red box) and the corresponding signal in the spectrum will automatically highlight in blue (increasing slightly its intensity); or vice versa (hovering the mouse over the peak will highlight the corresponding atom on the molecular structure).

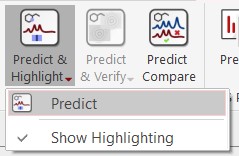
A similar procedure will be followed to run X-Nuclei predictions: 31P, 19F, 15N, 17O, 29Si. In this case, follow the menu 'Molecule' and select the desired option:

Predict & Highlight
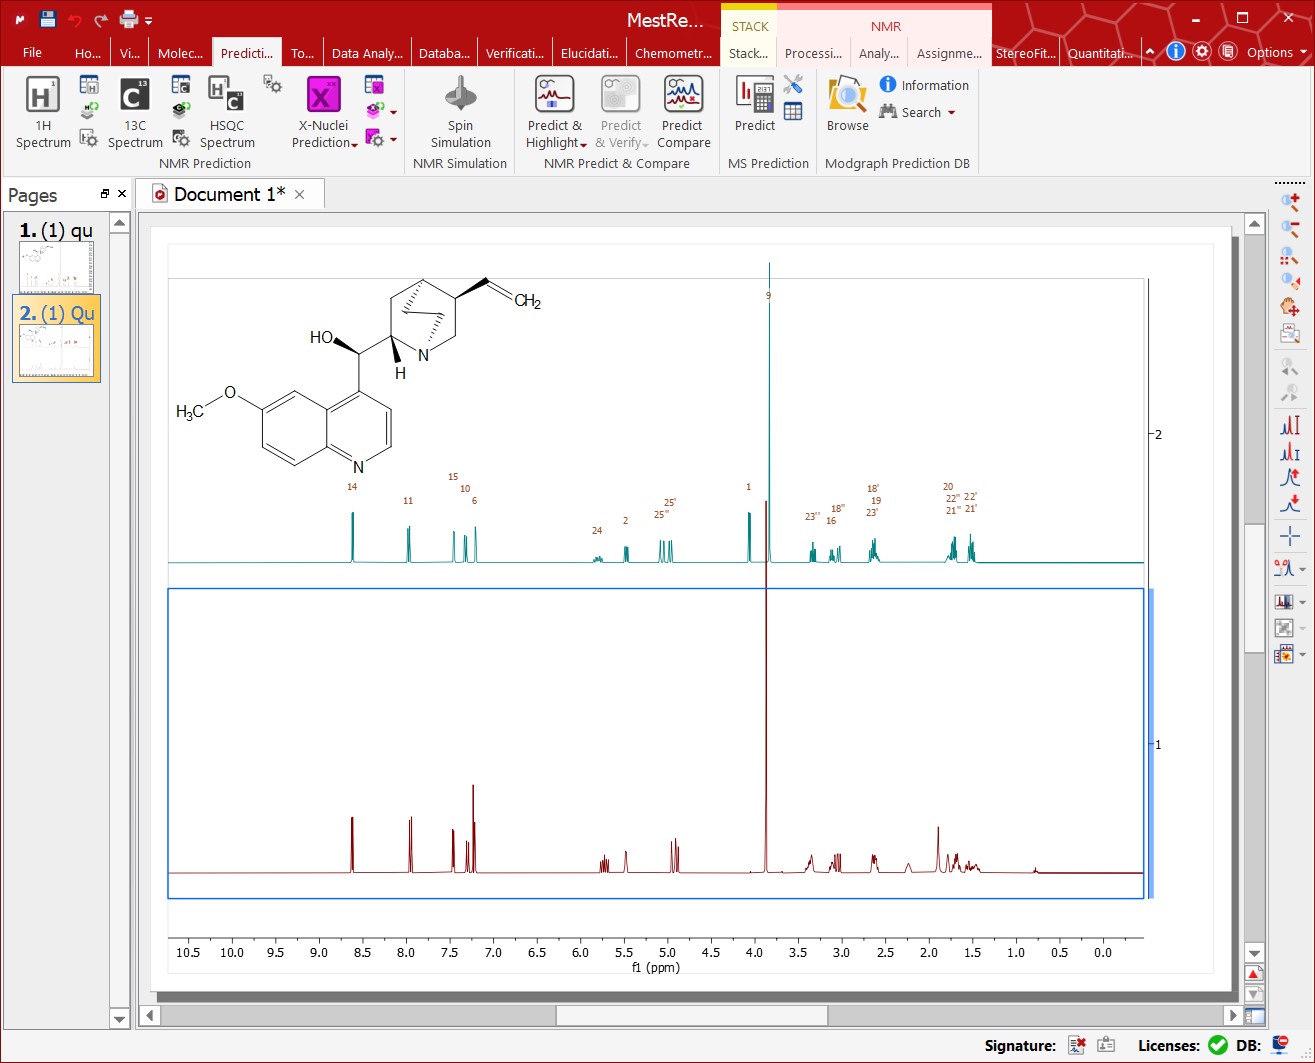
This feature will calculate in the background a simulation of the spectrum of the molecular structure present in the spectral window (with a real spectrum- Note it is a real spectrum here!) highlighting the expected chemical shifts when the user hovers the mouse over a proton or a carbon. The user will be able to use this tool just by pasting the corresponding molecular structure over the spectrum and following the menu 'Analysis//Predict & Highlight/Predict', as shown in the picture below:
Hovering the mouse over an atom will highlight the area on the spectrum corresponding to the simulated value for that atom.
Predict & Compare
Just paste the corresponding molecular structure over the spectrum and follow the menu 'Analysis/Predict/Predict & Compare', as shown in the picture below:
This feature displays, in stacked mode, a simulated spectrum for the molecular structure present in the spectral window, highlighting the expected chemical shifts when the user hovers the mouse over an atom on the molecule. This tool can be very useful as assistance in the process of assigning 1H and 13C NMR spectra.
Predict & Verify
Just paste the corresponding molecular structure over an HSQC spectrum and follow the menu 'Analysis/Predict/Predict & Verify/HSQC, as shown in the picture below:

It predicts the 1H and 13C chemical shift ranges of each CHx group, and displays that as a rectangle. The rectangle is colored as green, yellow or red depending on whether an experimental HSQC cross peak is found around the center, around the edge or outside of the rectangle. This feature provides the user a visual verification of the compatibility between the structure and the HSQC spectrum.
