

Molecule match analysis determines the possible presence of one or more given structures (or formulae) within a mass spectral data set. The isotope cluster of each structure is computed and compared to each mass spectrum in the data set. The mass spectrum with the best match that returns a score above the preset threshold is taken as a positive match. If no positive match, the structure it is taken as "Not found".
The constraints dialog allows the user to select one or more adducts/losses, specify ion polarity, and other parameters. The algorithm makes use of fast isotope cluster calculations and a sophisticated spectral matching technique. The applications of molecule match analysis include small molecule confirmation and metabolite identification.Limitations are few but include the requirement that the acquired spectra of the compounds being analyzed exhibit at least partial isotope clusters.
Just load your spectrum (TIC and MS) and paste the molecular structures into any page of the same document (or load whole spectral libraries by opening an sdf file). Next click on the 'Calculate Molecule Match' button of the toolbar  (or follow the menu 'Mass Analysis/Molecule Match/Calculate').

The 'Molecule Match' table with the results will be displayed. This table will contain information about the 'Retention Time' (RT), Scan (number of spectrum), Match Score, Similarity, MS Purity, etc.
Similarity is the comparison of the computed isotope cluster of a given molecule's molecular formula, plus optional adduct - that is, the mass spectral peaks of the molecular ion - with the mass peaks of the acquired spectrum in that mass region. The similarity value can be from 0 to 1, and you will note that a threshold of 0.8 is used. For instance, a pesticide named Pydrin, with a molecular formula of C25H22NO3Cl, plus an adduct of H, has an isotope cluster of 420.137 - 100%, 421. 140 - 28%, 422.135 - 36%, 423.137 - 10%, 424.140 1.5%. This is compared with the mass peaks of the acquired spectrum in the mass range of about 420 to 425.
Match Score is the produce of Similarity and MICC value (see below). MICC is the match molecular isotope-cluster chromatogram which is the sum of mass chromatograms of all the significant peaks in the isotope cluster. Using the example above, m/z 420.137 + 421.140, and so on.
This is almost the same as the mass chromatogram, across several Daltons, in the case listed above, from m/z 420 425. The reason it is not the same is that for accurately measured mass spectral data, a small tolerance on the order of a few ppm might be used for matching. For any given molecule, the MICC is normalized to 1.0, and this value is what is used for Match score above.
MS Purity is the proportion of the total intensity of the mass peaks matched in the Similarity measurement relative to the total intensity of the whole spectrum. MS Purity is then, the fraction of the found molecular ion intensity versus the total intensity of the spectrum. This assumes that most of the intensity of the whole spectrum will be due to the molecular ion cluster, which is true for soft ionization mass spectra, which is true for most forms of ionization in use today, which is not to be confused with MS/MS experiments, which have impart additional energy to produce fragmentation.
So, using the MS purity as a metric generally provides a useful value that is a larger value with "pure" spectra, that is spectra without a lot of background (or overridden by the intensity of the molecular ion) or without a coelutant. Clicking on any 'matched molecule' will display the MICC. In this example, the best result was for the compound number 1 (C20H23N). You can see in the picture below the MICC (in blue) over the TIC (in red):
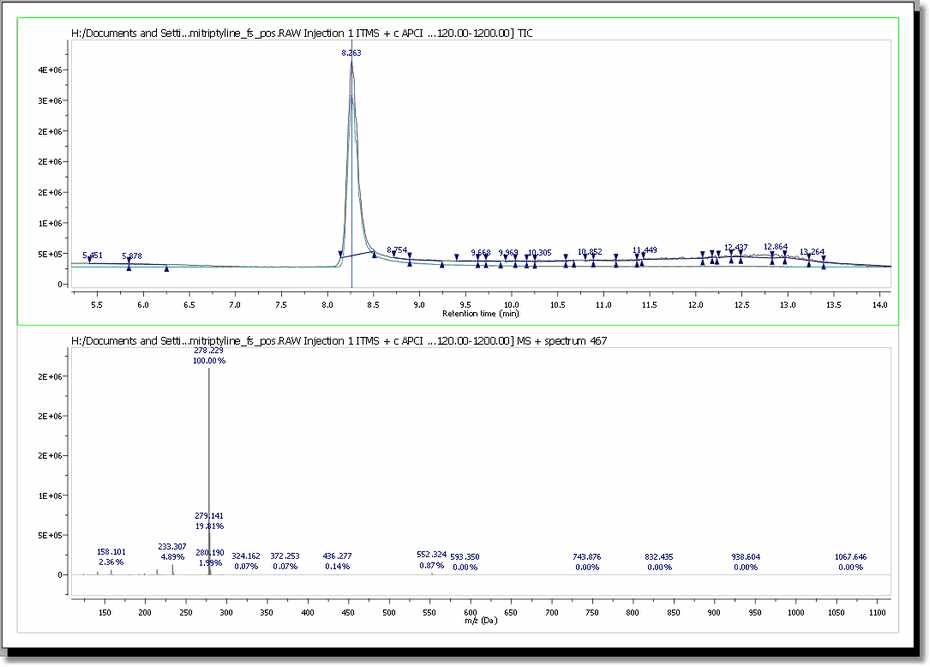
In addition, Mnova shows you in the chromatogram the retention time of the match (with a blue vertical line) and displays the corresponding MS spectrum (the number 467 in this case) overlaid with the theoretical one (in blue at a M/Z around 278, in this case). It is possible to show/hide the MICC and the theoretic MS just by clicking on the 'View Molecular Match' icon
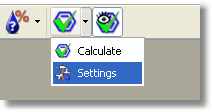
It will be possible to set the 'Molecular Match' settings just by selecting 'Settings' on the 'Mass Analysis/Molecule Match' menu (or under the Molecule Match scroll down menu):
This will display the 'Molecule Match Settings' dialog box:
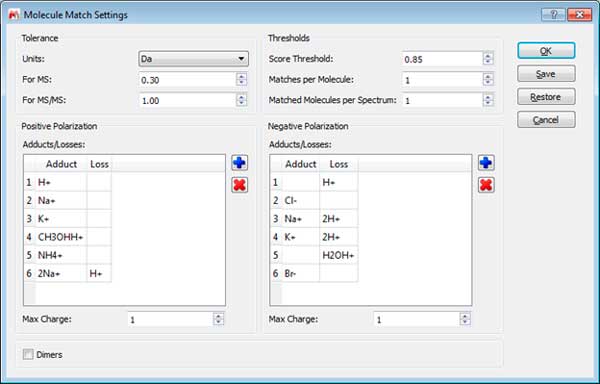
- Tolerance: To set the m/z tolerance for matching predicted spectra to experimental; by default, MS spectra are matched to either 5 ppm or 0.5 Da, and MS/MS to 10 ppm or 1.0 Da, depending on whether the spectra are derived from high or low resolution instruments.
- Thresholds: Set match score threshold for acceptable result; in most cases the default value of 0.5 is more than enough, however for weak / noisy spectra, the threshold may be lowered.
- Matches per molecule: To set the maximum number of results per molecule; by default, a molecule is allowed to match only once, in which case the best result is returned. However, if no MS/MS spectra are available and the sample is known to contain isomers, then increasing this limit will allow the molecule to match every isomer peak.
- Matches per spectrum: Set maximum number of molecules allowed to match a spectrum; by default, each spectrum (or set of related spectra) is allowed to match only one molecule. However, if isomers are present in the molecule list, then allowing all matches may be desired.
- Adducts: Set adduct/loss pairs using proper atomic or chemical formulas with charge notation.
- Charges: Set maximum charge states to consider. By default, +/- 1 are the maxima.
- Dimers: Set to enable consideration of dimers when matching; by default, dimer matching is disabled.

