
Biodiesel (BD) is fuel that is produced from a variety of plant and animal fats and oils. Before it can be blended with petroleum diesel fuel (DF), the product is subjected to a transesterification reaction, to usually generate the fatty acid methyl esters. Whilst car engines can be modified to run on pure BD, it is typically blended to a level of 2-20%, removing this need. Determining the percentage of BD (%BD) in a blend is clearly an important analytical check.
Simple Mixtures Analysis (SMA) is an MNova plug-in for targeted mixtures analysis using NMR data. It can be configured by the user to generate almost any experiment that relies on integration data extracted from each component, and convert these into meaningful analytical numbers.
The NMR of these fuel blends has received some attention [1]. There are several factors that make it quite simple to distinguish the BD from the petroleum diesel fuel (DF), the simplest being that BD oils uniquely have olefinic functionalities, and (typically) a methoxy singlet. Petroleum DFs, by contrast, uniquely have aromatic components, and no olefinic. Bearing in mind that the olefinic and aromatic signal regions of a 1H NMR spectrum are distinct and well separated, we can evaluate the best protocols for %BD determination.
In this article we will work through a simple analytical case, starting with the NMR method development, and progressing to creating and testing the SMA experiment. We will use the determination of biodiesel levels in fuel as an example.
Experimental
Low-field NMR (LF-NMR) is well suited to the task of BD determination [2] because excellent signal dispersion is not required, and we are not sample limited. For this example, spectra were recorded on an Oxford Instruments Pulsar 60 MHz spectrometer. Biodiesel/Diesel fuel blends were purchased from VHG Labs and used neat. Spectra were recorded using a 30s relaxation delay, and 16 scans.
In the figure, below, we see the 1H NMR spectra of 100% BD (lower trace) and 10% BD/90% DF (upper trace). As expected, the BD sample shows prominent C=CH and OMe peaks (red boxes), and the 90% petroleum DF shows significant signal intensity in the aromatic spectral region (blue box).

Method validation
Comparison using authentic samples
with the simplest protocol we compare the integral of a signature BD region with that of an authentic sample of 100% BD. Assuming that the sample preparation, measurement conditions, and data analysis are identical, this has the potential to be a very reasonable approach. We also assume that the spectrometer shows good sample-to-sample reliability.
This analysis was performed with manual “sum” integration of the olefinic region (5.8-4.8ppm), and the results are shown below. The absolute integral (AI) was used for this plot.
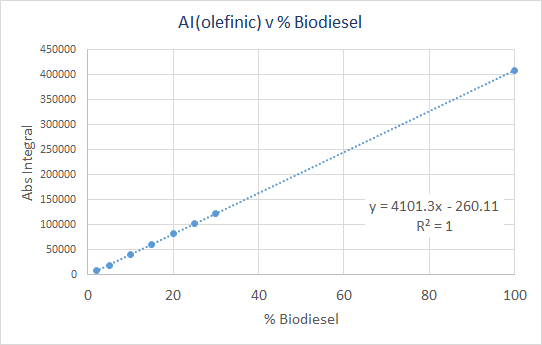
A closer analysis of the line fit shows:
- Slope = 4101.3 ± 6.7
- Y-intercept = -260.1 ± 263
- R2 = 1.0
Finally, 5 replicates of a 2% BD solution were examined in a repeatability test. For these, an average AI value of 8022.8 was obtained, and the standard deviation was 30.7 (0.4%).
There clearly exists an excellent correlation between %BD and NMR absolute integral of the olefinic region. It follows that a simple ratio method using the 100% BD integral value is a valid approach to a very accurate and precise measurement.
A ratio method
If the olefinic region represents only the BD and the aromatic region only the petroleum DF, it follows that the ratio of these area integrals should give a good estimation of %BD. The possible advantage of this method is that the result would be determined from a single spectrum rather than using a legacy sample spectrum.
For the following plot we see a ratio between the AI of the olefinic region (5.8-4.80ppm) and aromatic (8.5-6.00ppm), plotted as a function of the known %BD.
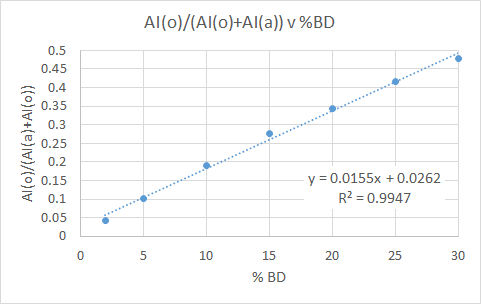
The statistics for the straight line fit are a little worse than before, but still acceptable.
- Slope = 0.0313 ± 0.0005
- Y-intercept = -0.026 ± 0.009
- R2 = 0.994
Finally, 5 replicates of a 2% BD solution were examined in a repeatability test. For these, an average value for the ratio of 0.0424 was obtained, and the standard deviation was 0.0003 (0.9%).
The “ratio method” described above provides a very acceptable, albeit slightly less precise method for %BD determination. This could be attributed to a doubling of analysis errors.
Creating the SMA experiment
In this example I will focus on the ratio method. For this analysis we need to constantly refer to the AI value for 100% BD – a value that was determined from that experiment (see chart, above).
Let us go through the steps now of creating the %BD determination in Mnova SMA. First, we need to specify the Library folder – which can be anywhere on the computer drive. In SMA, click on the “Library” icon, and navigate to the folder. If necessary, create a folder first. At this stage you will see a dialogue similar to this, where you can click on the blue “+” to add a new experiment.
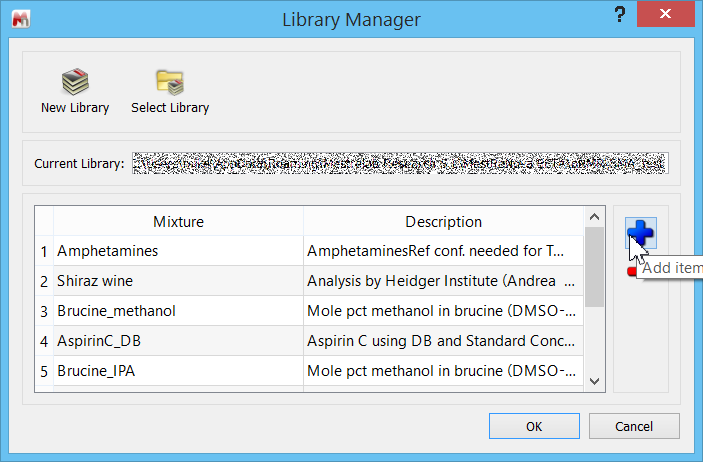
Click the “Add item” button to open a blank experiment panel.
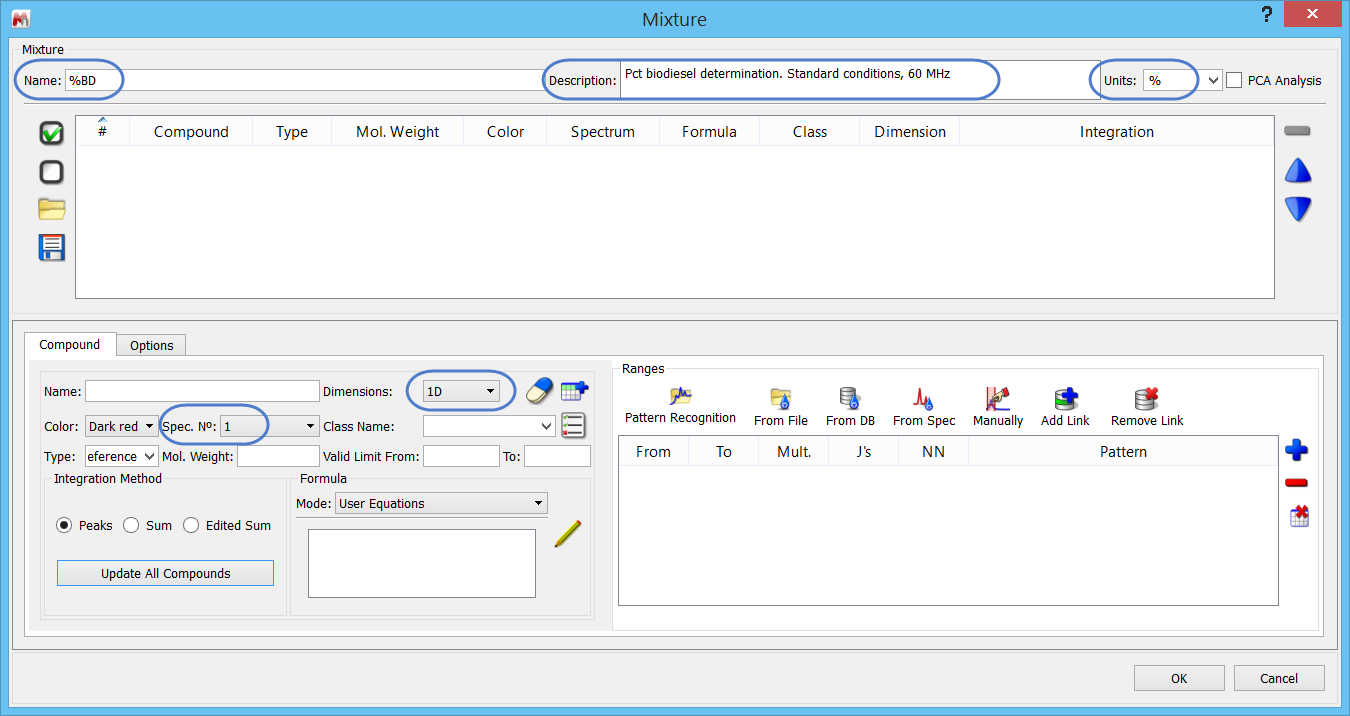
Let us start by specifying the following:
- Experiment name (free form text)
- Short description (free form text)
- 1D data will be used
- That we will use Page 1 from each document
- The units of the determination are “%”
Every SMA experiment requires one reference compound. The value for the Reference compound's equation is referred to as “CCF”, and has most obvious significance for concentration determinations. However, we will use a little short-cut and use this to store the AI value of 100% BD.

Note that when using fields for the first time, they may not hold any values: just type "Reference” in the appropriate free text area.
With the Reference specified, we only need to add this information to the compound table: click on the “Add new compound” .
![]()
Next, we specify the information for the BD. We can start by simply editing the existing compound sheet. We have to specify a chemical shift range to use, and a simple equation. This can be seen in the screen shot, below.
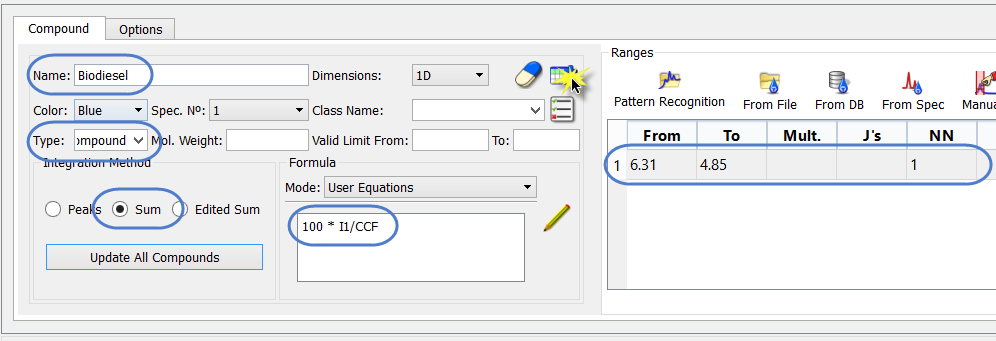
Note the following:
- The name has been changed
- The “Type” is now “Compound” (although name could be used)
- The PPM range must be specified, along with the number of nuclides corresponding to that. The NN is not used in this instance.
- The integration method is “Sum”, which is appropriate for a range.
The equation used to determine the BD is specified as: 100 * I1/CCF
What this means is that the AI for the olefinic region (I1) will be divided by the AI for 100% BD – which we have stored in the Reference compound equation. The result is multiplied by 100 to convert the ratio to a percentage.
Lastly, add the new compound to the Experiment, and click on the “OK” button. The experiment has been created, and will now be usable. Let’s see if it works!
To test the SMA experiment we just produced simply load the processed BD spectrum, and press the “Analyse” button to quickly obtain these results for %BD as determined by SMA:
| Gravimetric %BD | %BD by SMA |
|---|---|
| 2 | 1.98 |
| 5 | 4.76 |
| 10 | 9.84 |
| 15 | 14.96 |
| 20 | 20.08 |
| 25 | 24.88 |
| 30 | 30.20 |
A straight line fit to these data had a slope of 1.007 ±0.006, and intercept of -0.179 ±0.113, with R2 = 0.9998. An excellent result!
Implementing the ratio method
The ratio method that compares the integrals of the olefinic and aromatic protons can also be quite easily implemented. This would require specifying a range each for the olefinic and aromatic protons, as we did in the validation stage. We know from the previous analysis that this equation holds:
AI(olefin)/AI(aromatic)+AI(olefinic) = 0.013613*%BD – 0.054
In SMA we therefore need to rearrange the equation and determine the %BD and use this equation:
((I1/(I2+I1)) + 0.054)/0.013613
Conclusions
This simple ratio determination conveniently provides a validated method for %BD determination, with the LF-NMR providing very acceptable quality spectra, and reliability. With the conditions for data processing now determined, it is a simple task to convert this into an SMA experiment. Thereafter, the (automated) analysis of multiple samples is a very quick and simple matter.
References
[1] Knothe, G. (2001). Determining the blend level of mixtures of biodiesel with conventional diesel fuel by fiber-optic near-infrared spectroscopy and 1H nuclear magnetic resonance spectroscopy. Journal of the American Oil Chemists’ Society, 78(10), 1025–1028. http://doi.org/10.1007/s11746-001-0382-0
[2] “Monitoring the Preparation of Biodiesel with Benchtop NMR”, http://nanalysis.com/wp/?p=729
Acknowledgement
The data were acquired and kindly supplied by Dr A. Gerdova (Oxford Instruments). These, and insightful input, is gratefully acknowledged.


 and Mestrelab Research, S.L. (Mestrelab)")