
It is quite common for NMR peaks or multiplets to move position (chemical shift) through the course of an arrayed experiment. Sometimes this may be undesired and need correction through an alignment procedure, but there are times when this reflects the chemistry that is occurring in the sample tube. The changes may be a consequence of pH changes – deliberate, or resulting from a proton transfer that is part of a chemical reaction. Or the chemical changes to the compounds in the tube could very be the result of new molecules having quite different electronic environments, and therefore chemical shifts.
The Data Analysis capability in Mnova is geared towards the extraction of intensity, integral, or chemical shift information in a stacked series of related spectra. This capability finds extensive use in the study of chemical reactions using NMR, which is often simply called “Reaction Monitoring” (RM). Typically, one or more NMR spectra are recorded at regular intervals through the time course of the reaction. Such “time sliced” data then need quick information extraction – which is the task of the NMR software.
There are a host of difficulties and challenges that are inherent to this data extraction task, and Mnova provides a wide variety of capabilities to facilitate the task. Usually this can be done with minimal user input. The task of extracting data for multiplets whose chemical shifts change in the stacked array has traditionally been tackled with a largely manual process: the user would select a region that is close to what is required. The regions have “handles” which the user can drag, and thereby change the centre and width of the integral region. It is therefore possible to use these to “feed” the multiplet into the integrated region, marked in light green.
Automated peak tracking
But wouldn’t it be much better if peak integration was done perfectly and automatically? In fact the task is more complex than originally stated here because the following are quite common, and the algorithm must be tolerant to their presence:
- Multiplets change at different rates through the array – it is not a linear process
- Multiplets may move in different directions in one experimental array
- Multiplets may change multiplicity
- Peaks may change width
So, let’s see how well it works!
Implementation
The functionality is activated by default, but can be toggled off.
You must first select a spectrum in the stack where the peak/multiplet is present. Then, after specifying the graph you want to generate (Integrals, Concentration, etc.), drag across the multiplet of interest. That’s it! The pairs of blue arrows show the stop/start points for the click-and-drag operation that was used to select the region on the active spectrum.
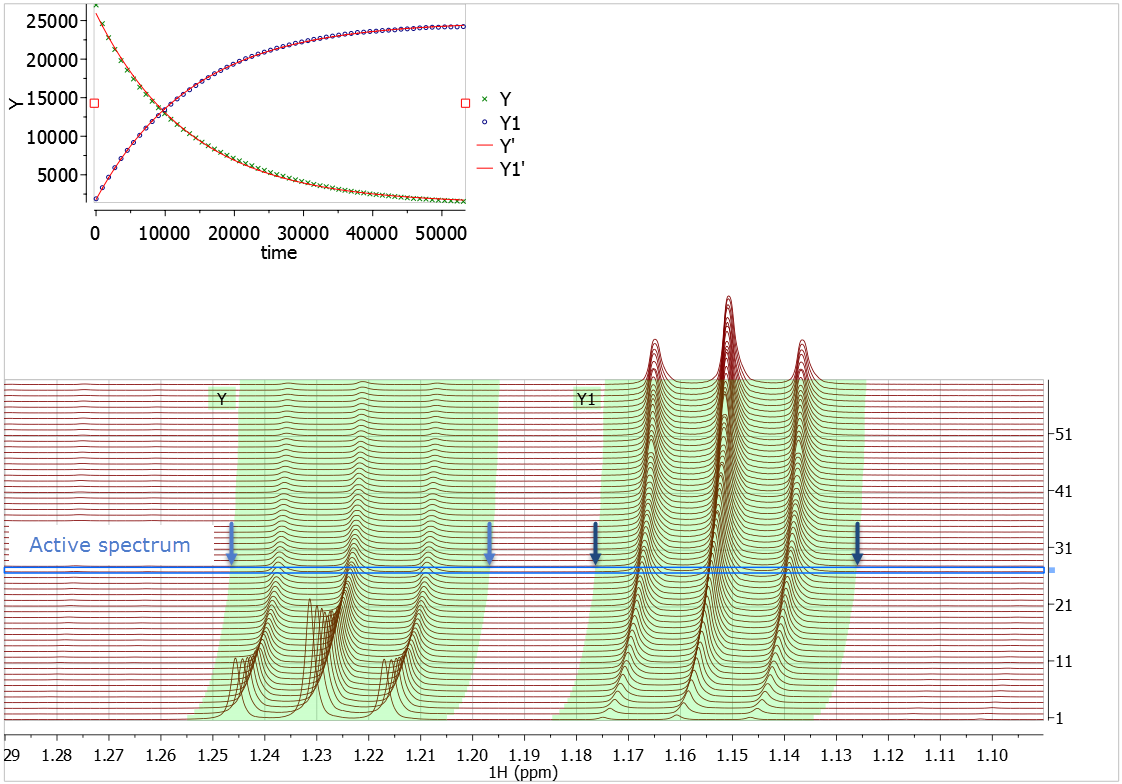
Example 1: A multiplet with no "direction"
The chemistry isn’t important. What you see here is some quite complex phenomena that cause a multiplet from a labile proton at ca 5.0 ppm to take quite an unusual trajectory and alter its multiplicity.
We see that each and every spectrum in the array has an optimal integral region after the Automatic Peak Tracking was applied.

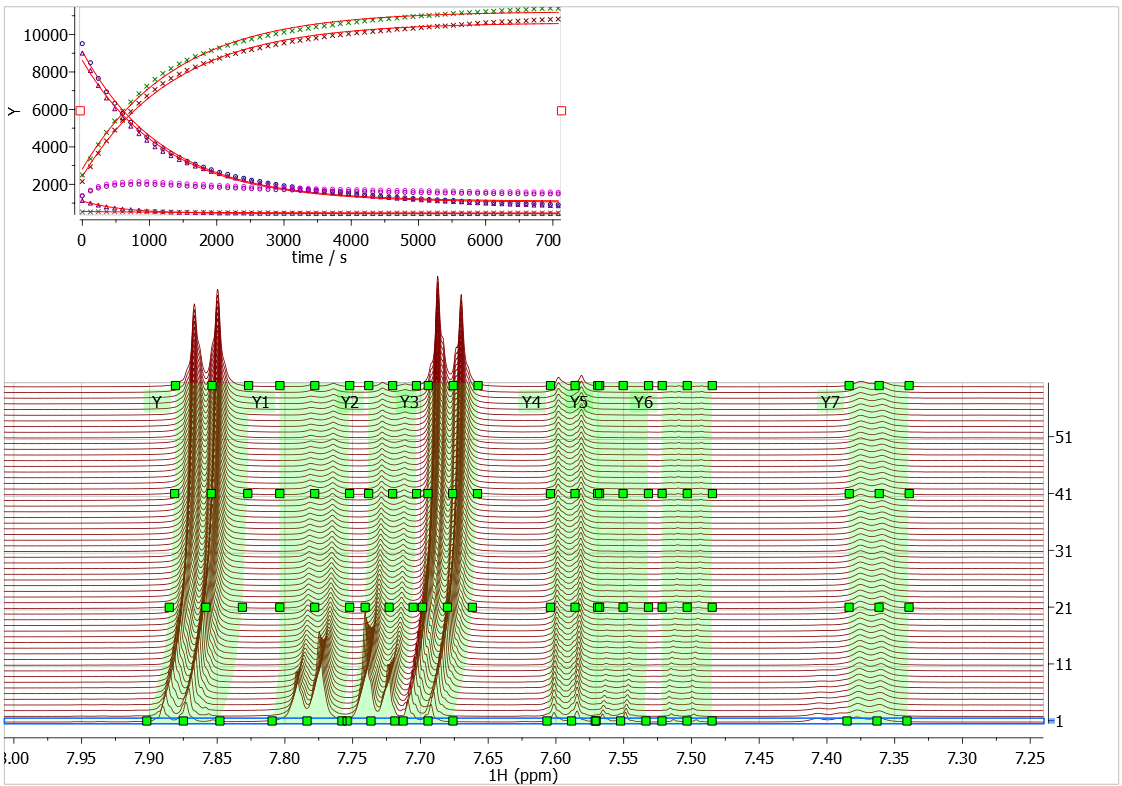
Example 2: Quick and accurate
In this example I have simply used Automatic Peak Tracking to allow me to very quickly generate curves for the seven multiplets – which all move through the course of the reaction.
Each multiplet was correctly selected with a single click and drag operation, making the analysis very quick indeed!
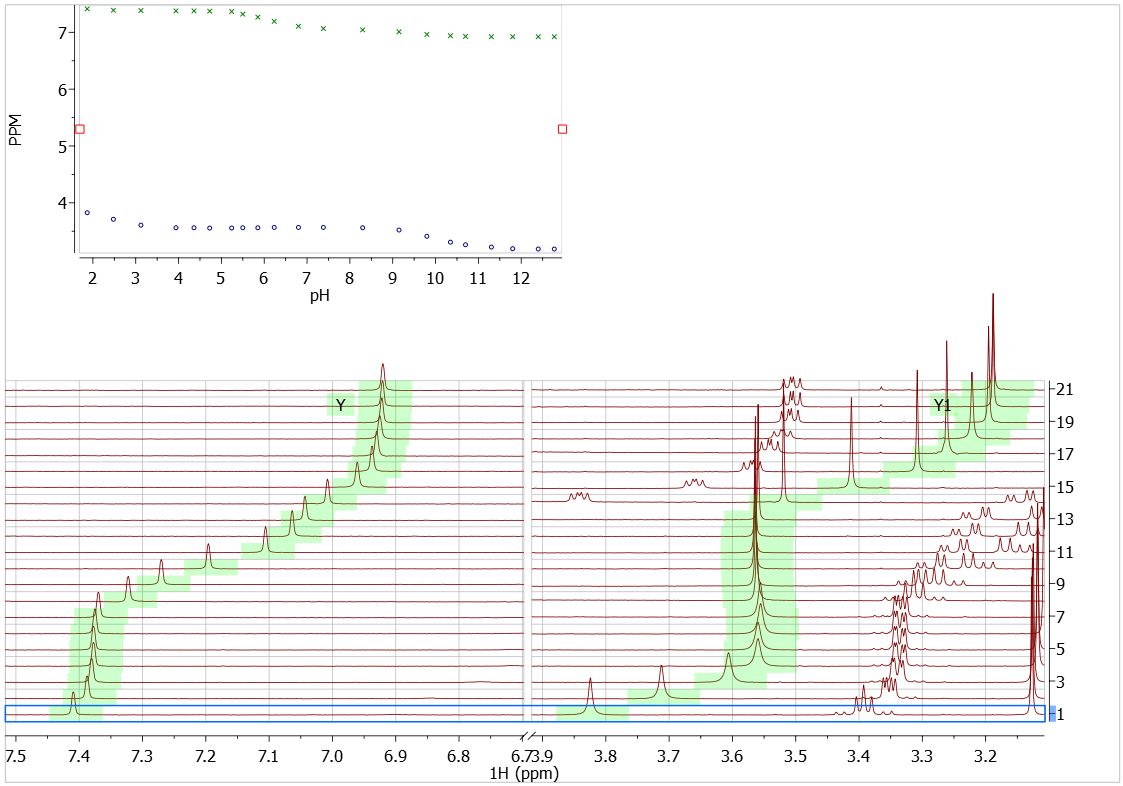
Example 3: pH titration
A pH titration of a histidine-containing peptide causes some quite large chemical shift changes to occur. In the example, below, we see Automatic Peak Tracking successfully applied to two signals. Chemical shift changes are relatively large, but the singlets are nevertheless automatically tracked. This is quite a difficult test!
Conclusions
It is possible create an Automatic Peak Tracking algorithm that works well for a variety of real-world cases. This will significantly facilitate data extraction from more complex arrayed NMR data, further enhancing the capability of Mnova for this application.
Look out for this functionality in Mnova Ver 10.1, coming soon. If you can’t wait, drop me an email: mike@mestrelab.com


