
Many types of experiments require obtaining a series of FIDs, related to each other through the variation of one or more parameters (temperature, concentration, solvent...). The user, for example, may need to run several spectra at different temperatures: 270K, 300K, 330K, 360K and 390K. Instead of acquiring five different sets of data, the user is able to create an array in which the temp parameter is given for successively different values. Creating a stacked (or pseudo 2D) spectrum with Mnova is very easy. Just select the desired spectra in the page navigator (by holding down 'CTRL key' while clicking on each spectrum) and then issue the command 'Stack/Stack spectra':

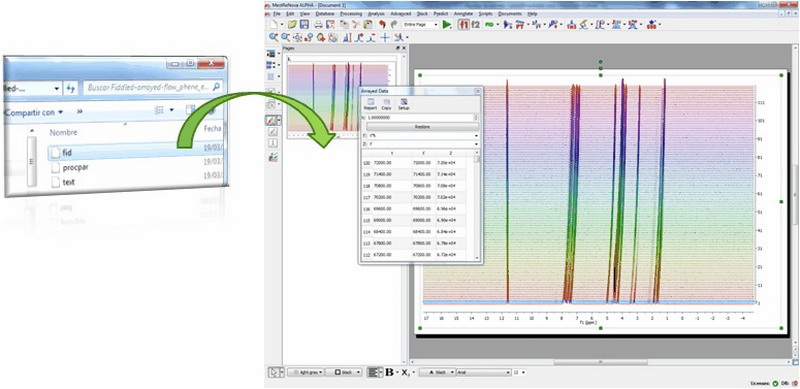
Additionally, Mnova can detect spectra which have been acquired in the so-called arrayed-mode (or pseudo 2D), typically used in relaxation, kinetics or diffusion experiments. For all these cases, Mnova will only process the acquired dimension (t2). Basically, Mnova will process only the rows of the data matrix and, by default, will display the spectrum as a stacked plot (see below):
How to set up the traces?
Sorting traces:
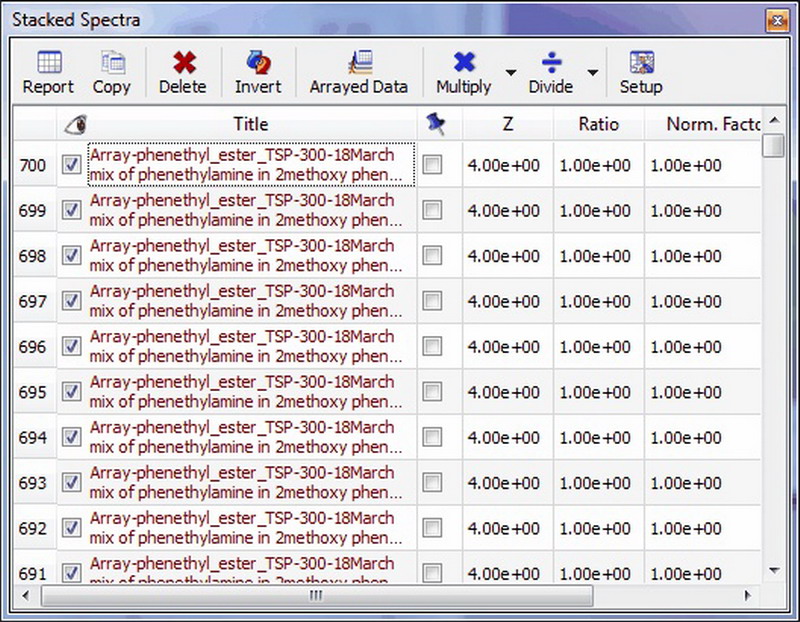
The user can easily sort the traces of the arrayed spectrum by clicking on the 'Stacked Spectra Table' icon ![]() to display the dialog box below:
to display the dialog box below:
Once there, click on the number of the spectrum for which you want to change the location and drag to the desired location.
Hiding traces:
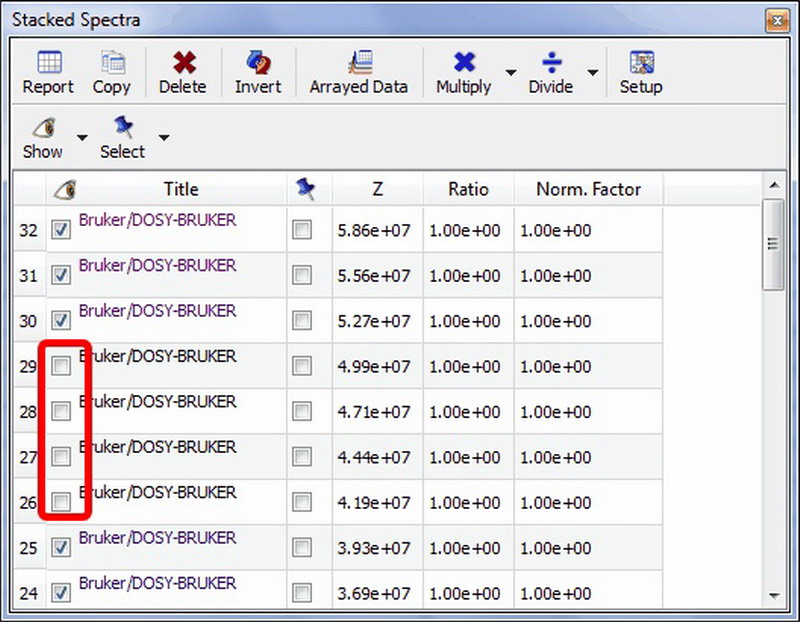
To hide any of the traces, just uncheck the left check boxes of the 'Stacked Spectra Table'
This table provides new options to easily hide or select any number of spectra

Selecting 'Decimation' will display this dialog box, which will allow you to show the slides from a range or the step or decimation factor (i.e, the slides 30, 60, 90, etc). This option is very useful when the number of stacked spectra is very large, slowing down the plotting and not showing relevant information Here you can see an example; showing the result of a R-M experiment consisting of 700 spectra, and how the dataset will look like after decimation:

Multiple spectral selection:
Mnova includes a powerful, yet easy to use multiple spectral selection mode, which allows the user to optimize the processing of groups of spectra by selecting a bunch of spectra and applying any processing (e.g. manual phase correction to the selected group). Multiple spectra selection can be done either graphically from the stack or directly from a table. In addition, Mnova now offers the ability to hide any number of spectra in an arrayed item.
Graphical selection of spectra
In order to be able to select a bunch of spectra graphically with the mouse, it is necessary to display the spectra in the stacked plot mode. To select a single spectrum, left click on the spectrum trace while keeping pressed the Alt key To deselect a spectrum: left click + Ctrl + Alt In order to select multiple spectra, follow the same operation as above while keeping pressed Ctrl and/or Shift keys.
Active spectrum vs Selected spectrum/spectra
Selected spectra: when the spectra are selected, they are highlighted with a light blue background. Any processing operation will take place only for those selected spectra. (To select a single spectrum, left click on the spectrum trace while keeping pressed the Alt key. To deselect a spectrum: left click + Ctrl + Alt) In order to select multiple spectra, follow the same operation as above while keeping pressed Ctrl and/or Shift keys. Active Spectrum: active spectrum is marked with a blue box and it indicates the spectrum which will be displayed in the active spectrum display mode. It’s also the reference spectrum used in some processing operations (e.g. alignment)

You can also select several slides use the check boxes on the right of the 'Stacked Spectra Table'. When the spectra are selected, they are highlighted with a light blue background. Any processing operation will take place only for those selected spectra.

To navigate through the traces in the stack plot, press and hold down SHIFT and use the up or down arrow key (or use the mouse scroll wheel). The active trace will be highlighted by default with a blue rectangle, whilst selected traces will be highlighted with a light blue background (those marks will not be exported whit the stack plot). Any processing operation will take place only for those selected spectra.
How to scale the traces of the stacked spectra?
The user can also change the intensity of the traces from the 'Setup Stacked' dialog box; which can be displayed by clicking on the applicable icon of the toolbar ![]() (or by following the menu 'Stack/Setup Stacked Spectra'). Once there, just check the box of the trace that you want to modify and click on the 'Multiply' or Divide' buttons of the dialog box (as it is shown in the picture below).
(or by following the menu 'Stack/Setup Stacked Spectra'). Once there, just check the box of the trace that you want to modify and click on the 'Multiply' or Divide' buttons of the dialog box (as it is shown in the picture below).

It will be possible to select the factor value just by clicking on the scroll down menu of the multiply or divide buttons.
")

