

We have just implemented in Mnova 12 a Computer-Assisted Structure Elucidation (CASE) system, which will take you from NMR data to structure through a simple to use and learn workflow.
As a starting point we recommend you to follow the following steps applied to this example:
STEP 1. Display options
The first thing you have to do is to enter in the ‘Elucidation’ section located in Mnova’s main menu bar Please note that the following screenshots show our latest “modern display (ribbon control)” but you can also choose to revert to the classic display mode.
On the main menu you can activate or deactivate the tool bar with the different options for Elucidation by clicking on the little pointed below. (This is recommended once you are already working with your spectra) but you can view the options activating it again.

STEP 2. Add the molecular formula
Enter the molecular formula of the compound of interest by either using the icon for it in the Elucidation menu or by using the instructions provided on the elucidation workflow to assist you during the elucidation process.
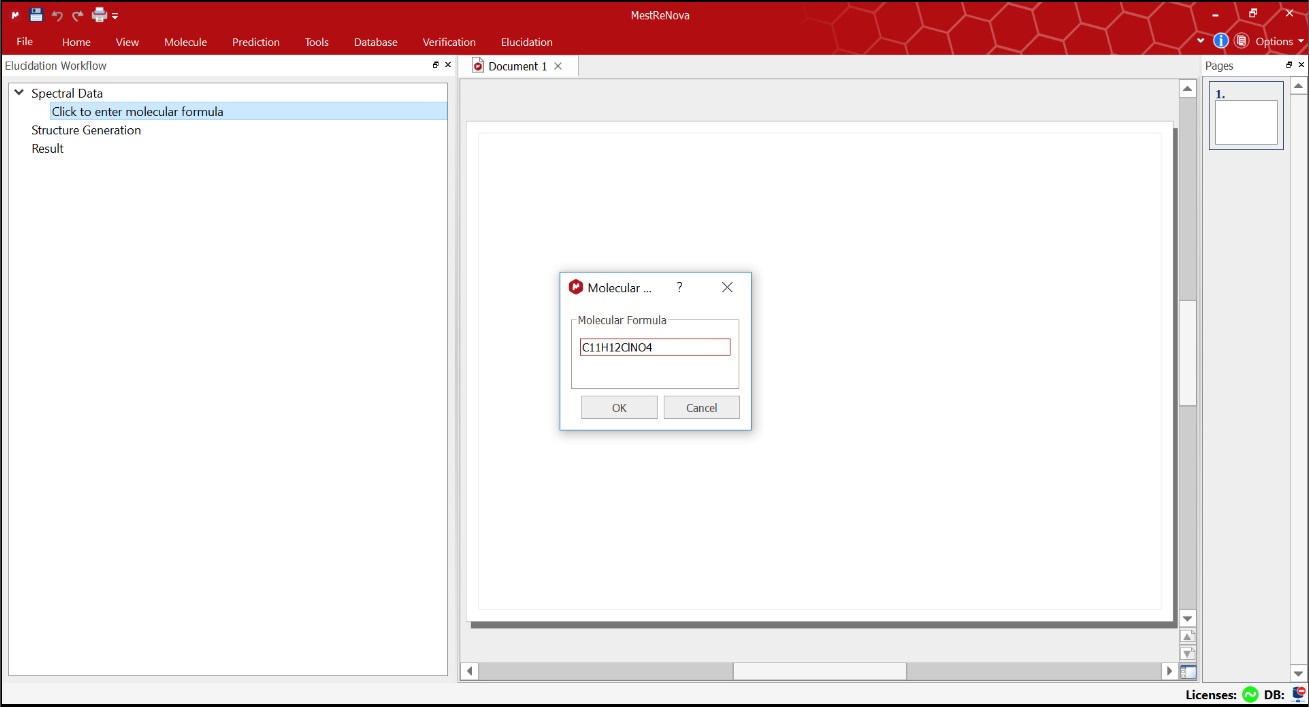
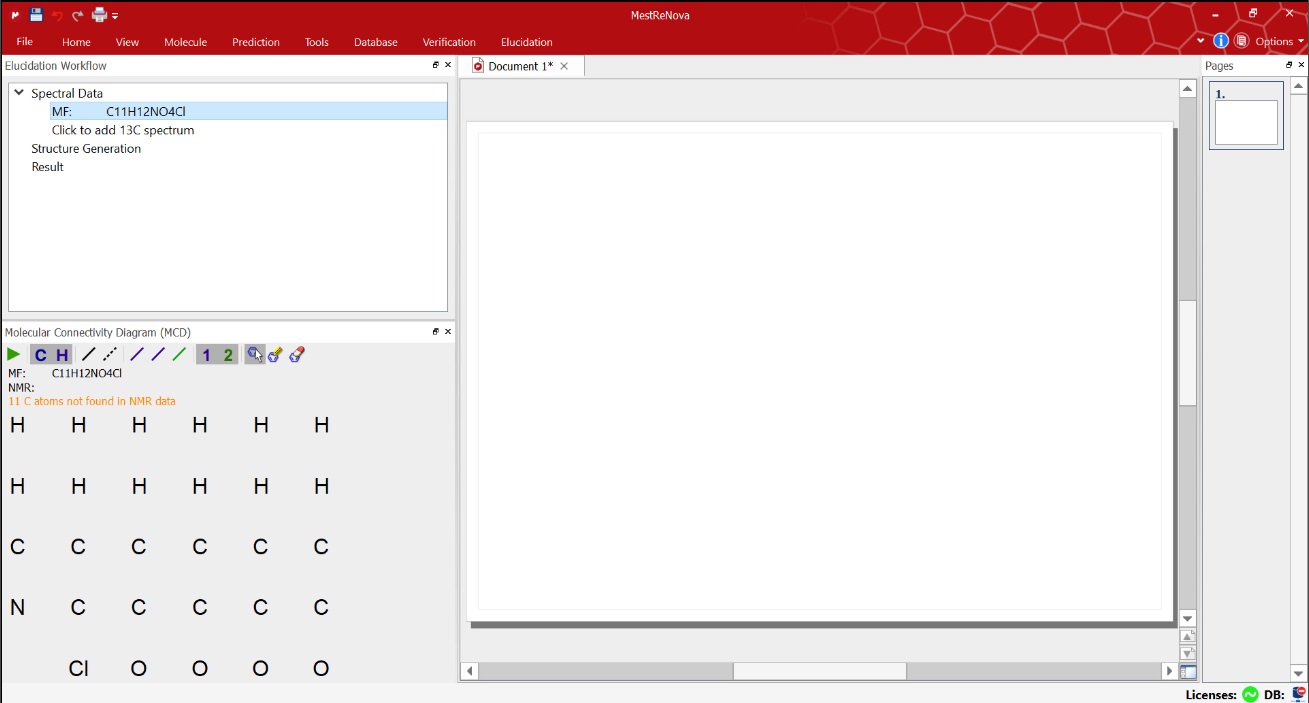
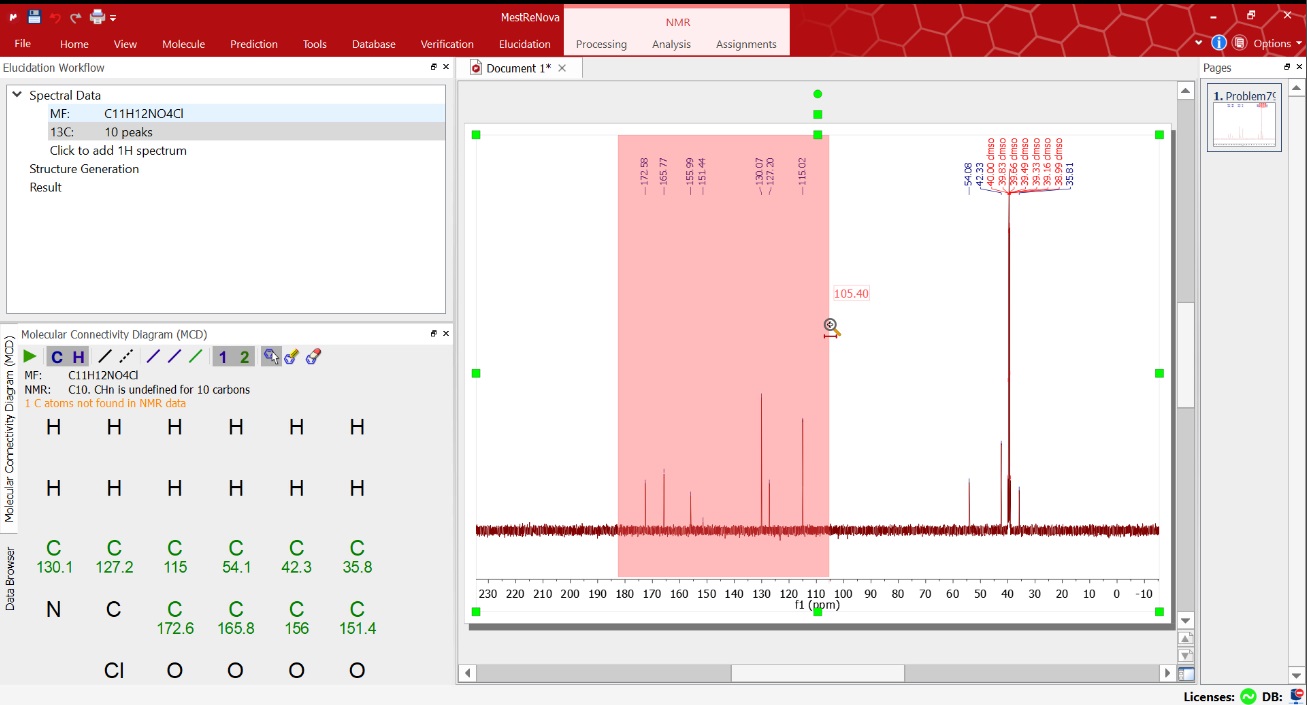
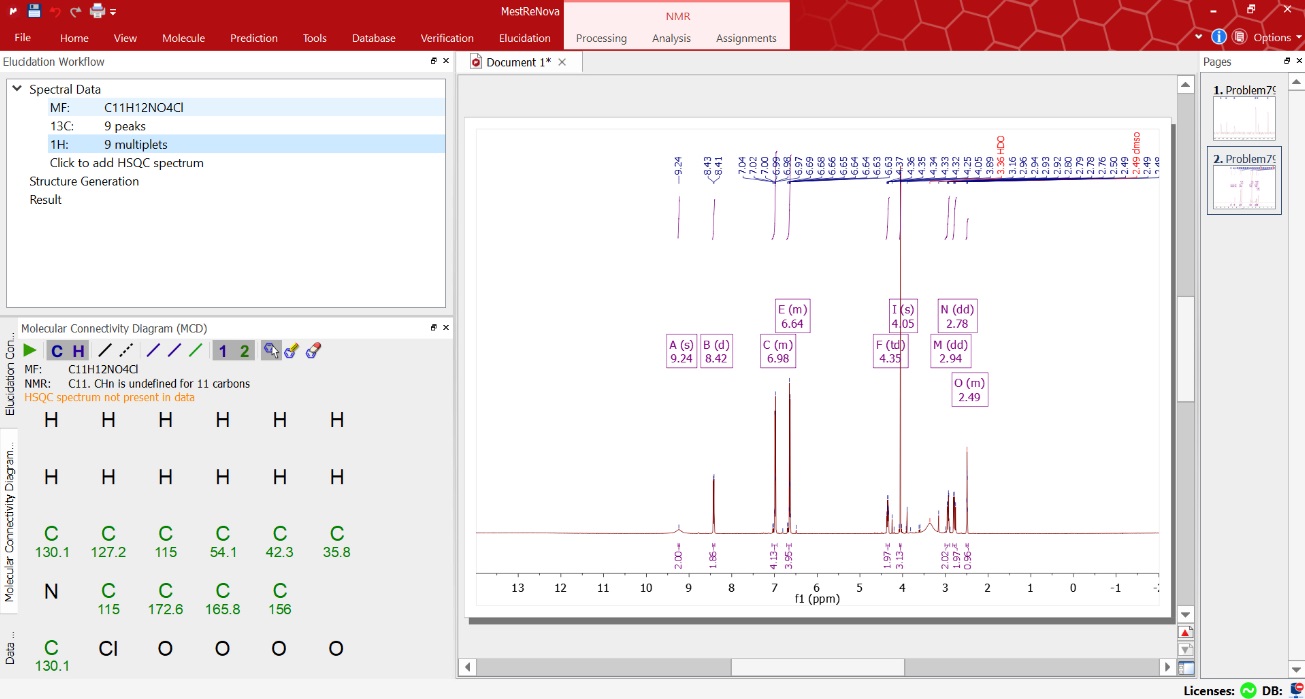
Once the molecular formula is entered, the Molecular Connectivity Diagram (MCD) will be displayed.
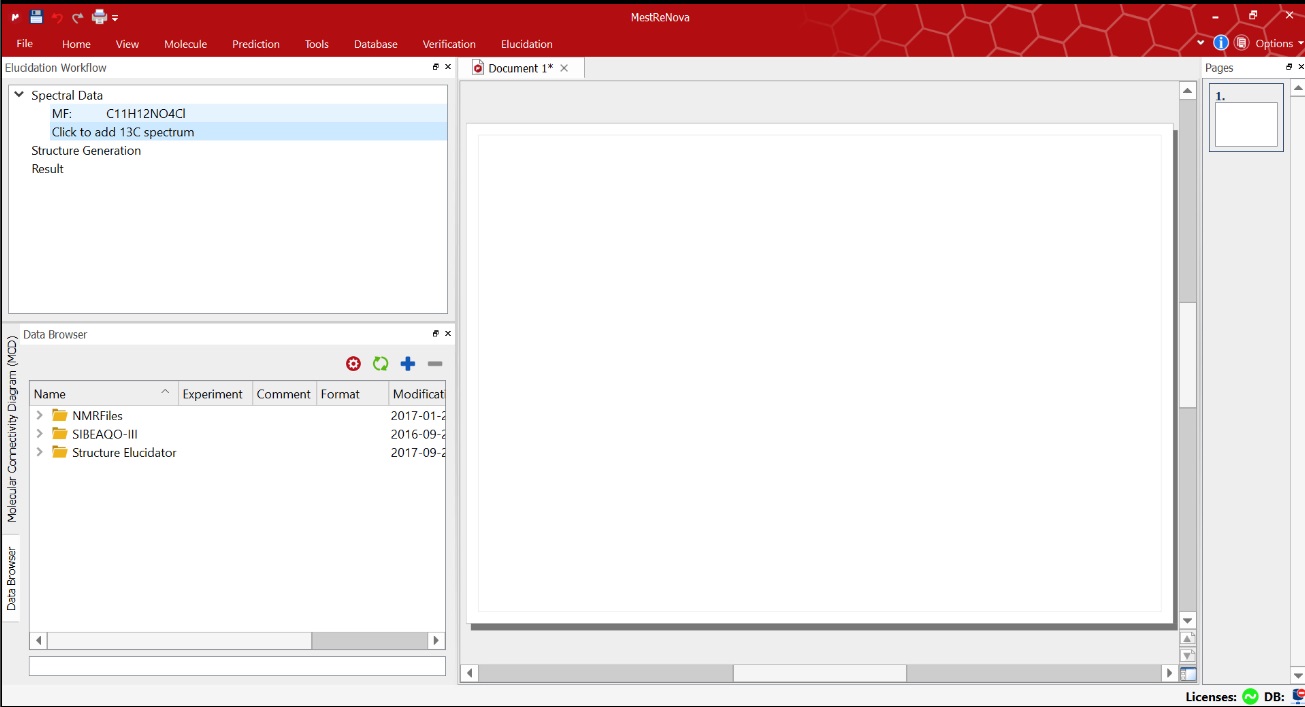
STEP 3. Add your datasets
Now everything is set to start adding the data files with your spectra for the elucidation of your compound.
First use the data browser to drag your data into the spectral window. By clicking “Click to add 13C spectrum” in the Elucidation Workflow, the Data Browser gets displayed so you can use it to drag your data into the spectral window (alternatively load the spectra via File/Open or drag&drop):
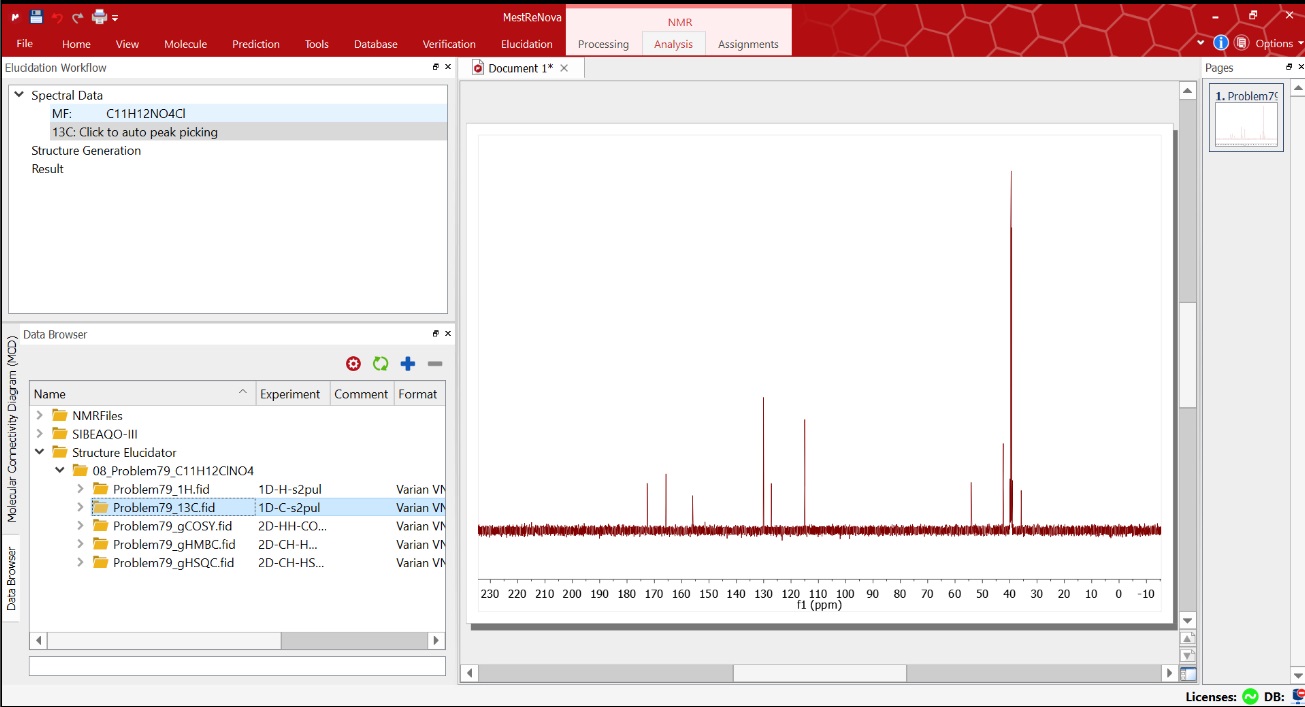
STEP 4. Peak picking
Under the Elucidation Workflow window select “click to auto peak picking” (alternatively use the icons under the Elucidation tool bar)

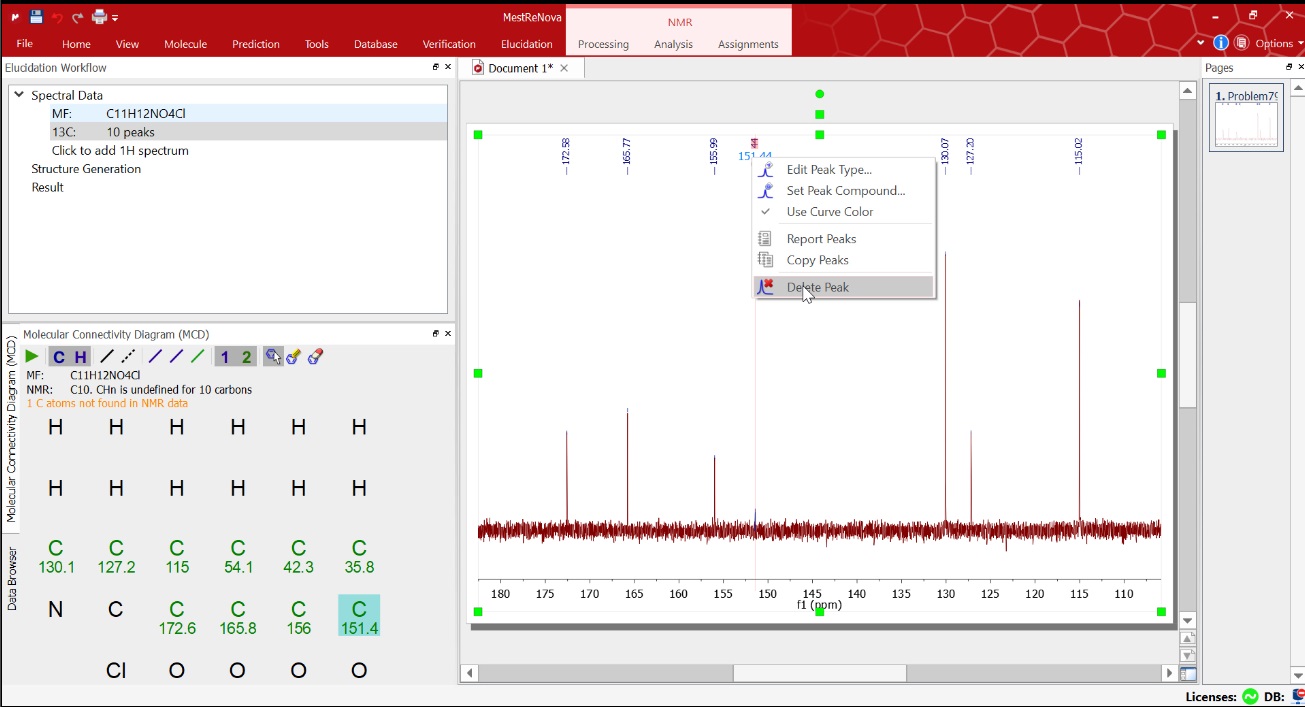
We can use the regular visualization tools and delete any peaks we do not want them to be part of the calculations i.e. too weak intensities, etc.
STEP 5. Elucidation constraints
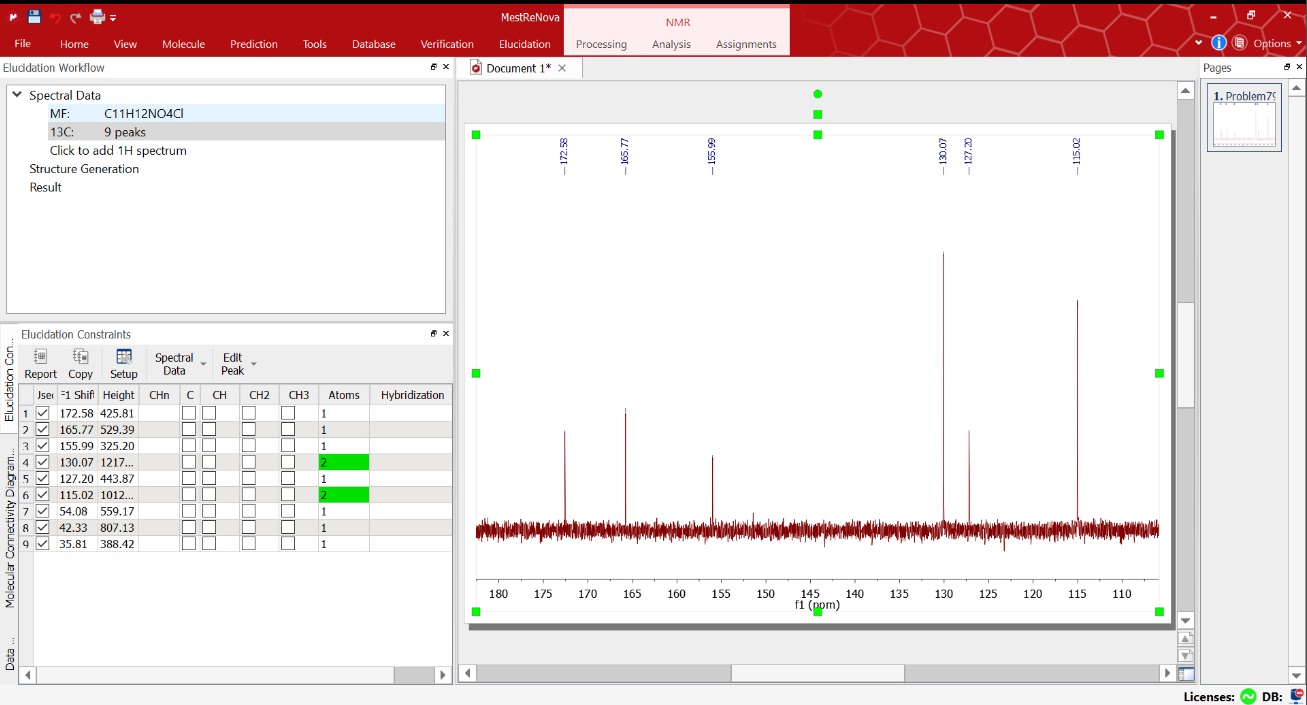
At this point you may want to select the option “Show elucidation constraints” under the Elucidation menu to tweak for instance any of the symmetric carbons to be counted as two. This can be easily done on the ‘spectral data’ option and choose 13C 1D (exp) in this case.
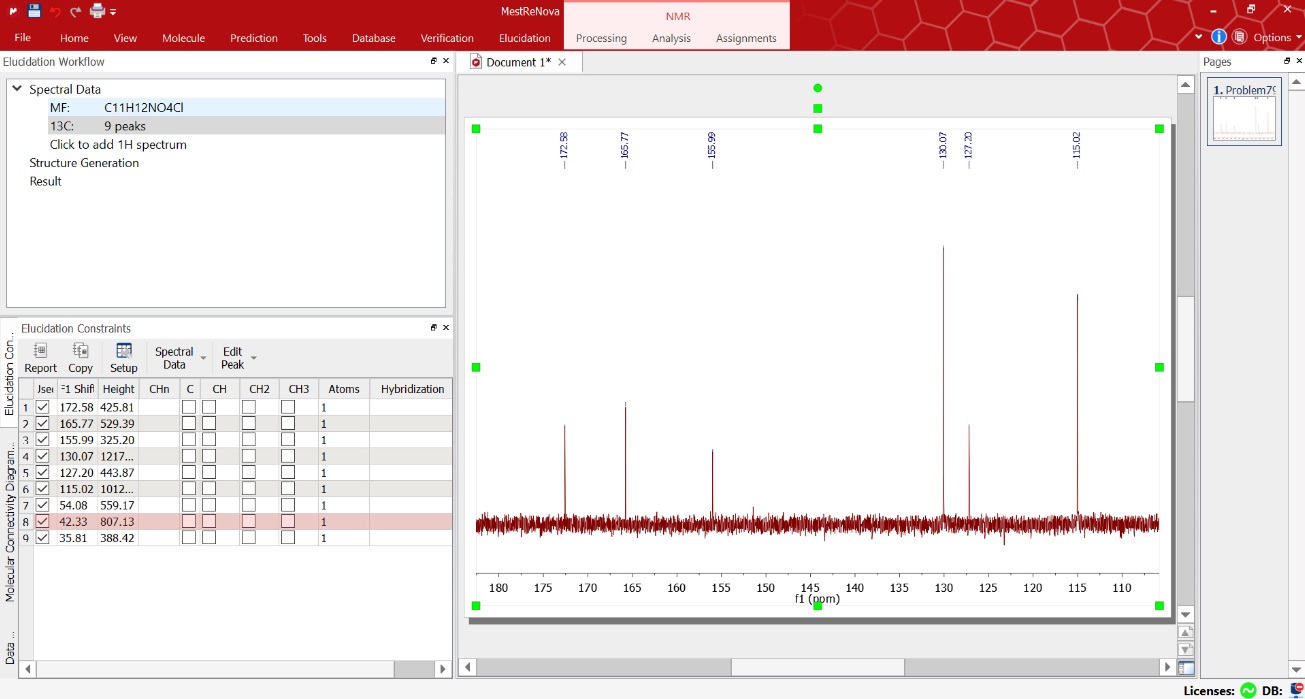
You can always check the ‘Molecular Connectivity’s Diagram’ looking for any warning messages present (orange color).
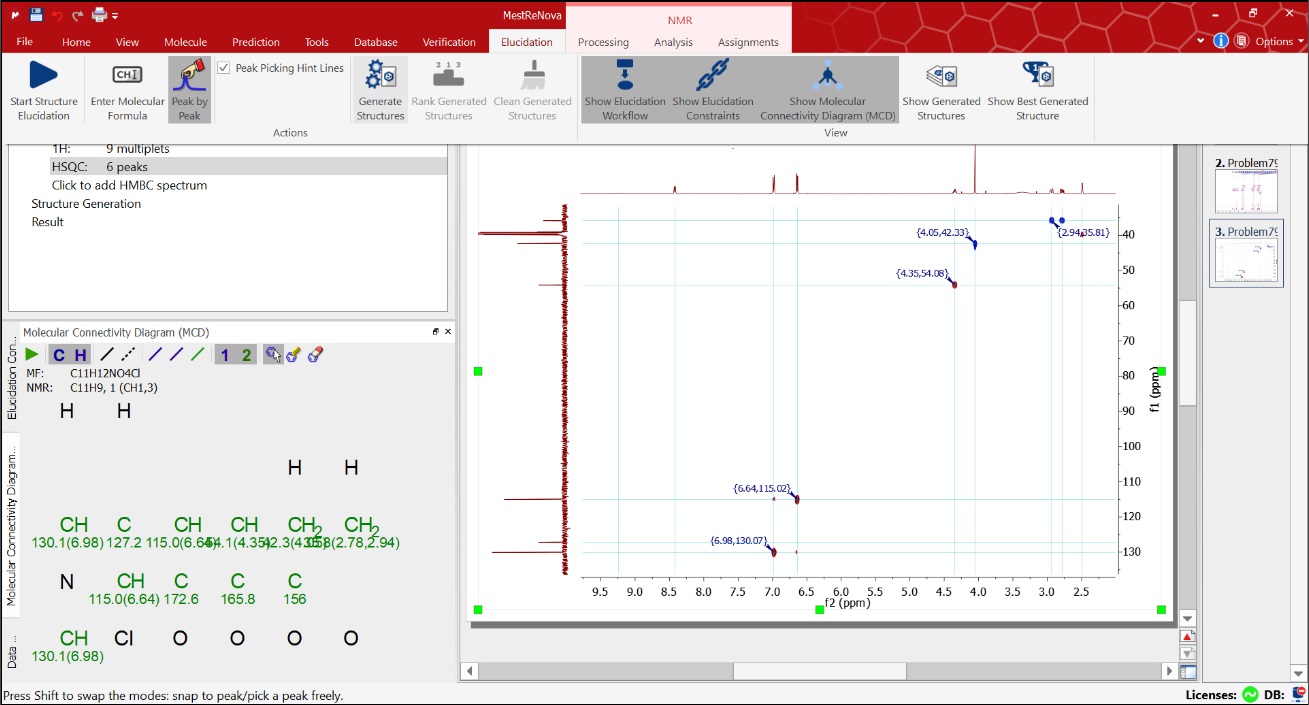
You can now add the rest of your spectra following the spectral panel instructions and analyze it as usual.
When carrying out peak picking analysis on the 2D spectra, select the cross peaks you think should be included in the analysis.
STEP 6. Structure generation
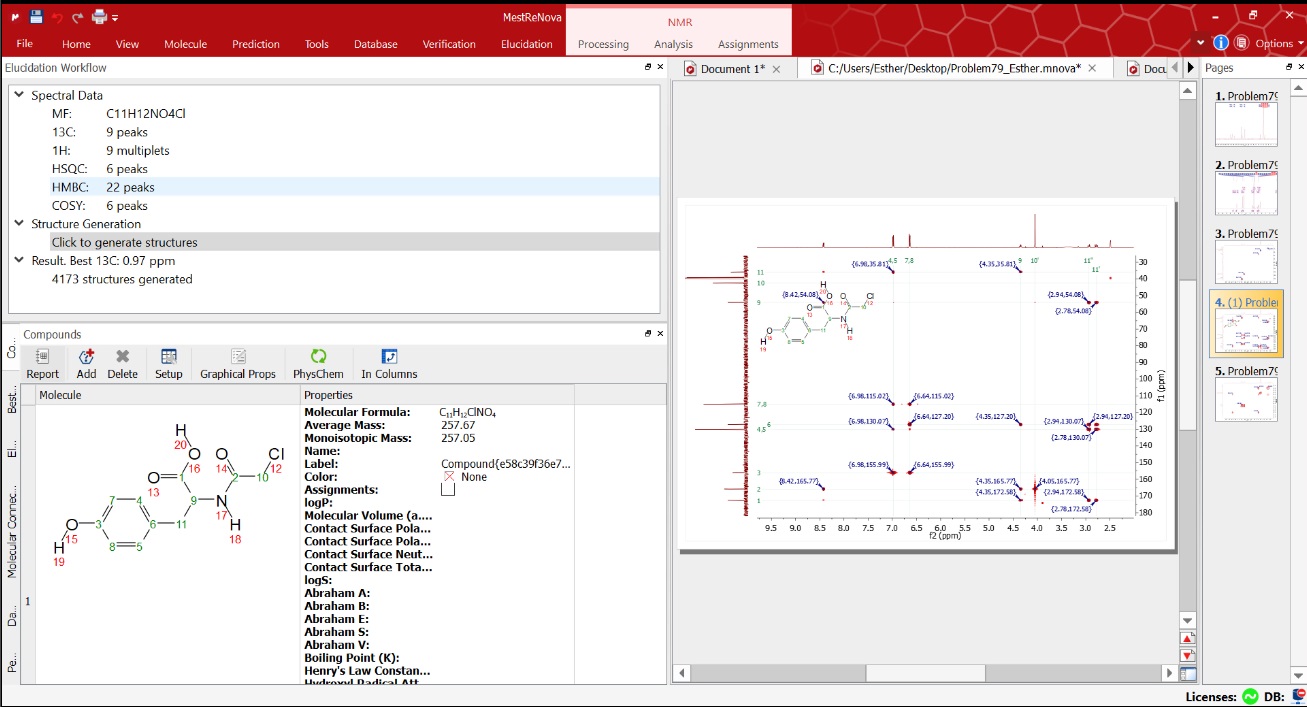
Once all your data have been analyzed then follow the instructions in the Elucidation Workflow to start ‘Structure Generation’:

This process may take a few minutes. In the meantime you can see the structures generated by the program clicking on the ‘Show generated structures’ and a table will be displayed. This table may be ordered by the structure ranking:

STEP 7. Ranking your structure
Once the elucidation is completed you can select the most probable structure (lower 13C RMSD)

And add it to the “compounds” table by clicking Copy Best button:
STEP 8. Check your assignments
You can also check the ‘Assignments table’ and check through your spectra:

STEP 9. Predict & Compare your 13C-NMR
Finally you can go to ‘Prediction’ in the main menu and carry out a 'Predict&Compare' to check the proposed structure.

If you find any trouble using Mnova Structure Elucidation for your particular cases or you have any suggestions please do not hesitate to contact us.
