
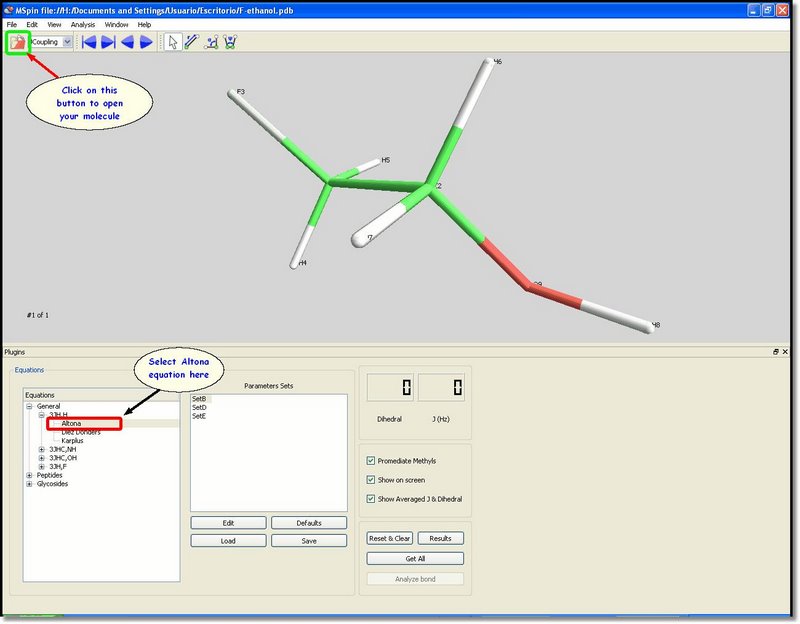
This tutorial will show you how to apply the JCoupling module to the fluoroethanol. Just load the molecular structure into Mspin by clicking on the 'Open Molecule' button (green square in the picture below) and select Altona equation (red square in the picture below).
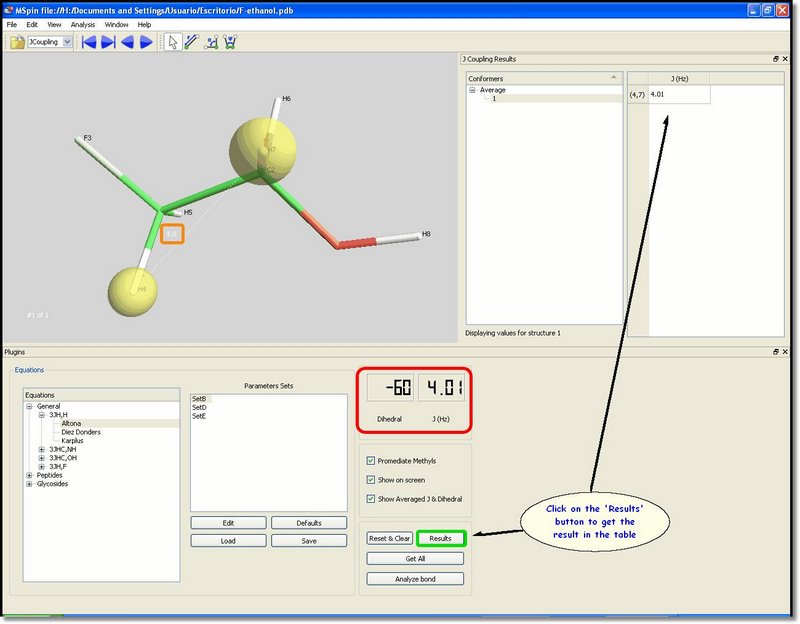
The user will be able to obtain the 3J value for a pair of coupled hydrogens just by clicking on two vicinal hydrogens. This will display the current dihedral angle and the 3J value on the LCD-boxes (red rectangle in the picture below). In addition, the 3J value will be displayed on screen (orange rectangle in the picture below) and can be shown in a table by clicking on the 'Result' button (green rectangle in the picture below):
Alternatively, all possible 3J values of the current molecule can be obtained by clicking on the 'Get All' button. Clicking on the cells of the table will highlight the corresponding atoms on the screen. It is possible to export the result to Excel by just right clicking on the table.

Please keep in mind that Mspin will average by default the 3J coupling constants of hydrogens attached to methyl groups by assuming a static model. The user will be able to deselect this default by using the corresponding check box in the green rectangle in the picture above.
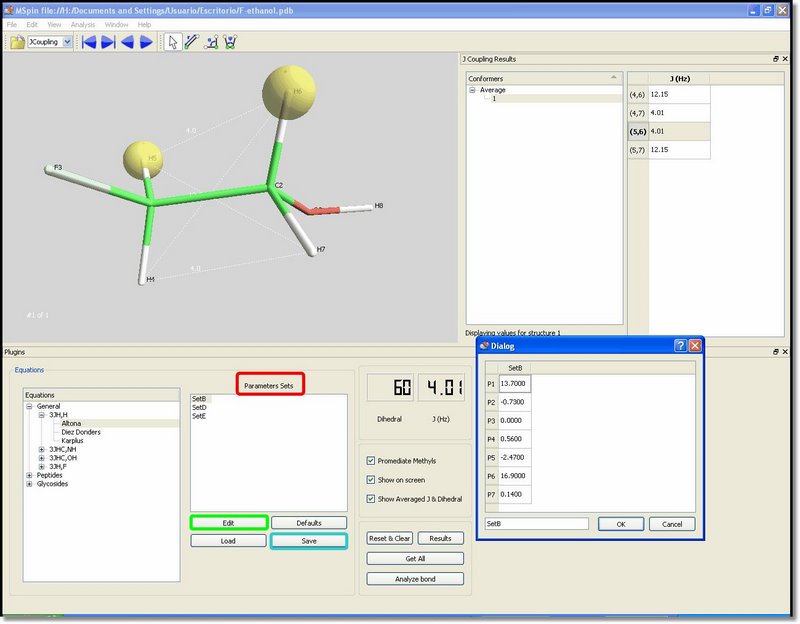
Note that equations like Altona can implement different sets of empirical parameters. Users can select the desired set on the 'Parameters Set' List (red rectangle in the picture below). Besides, parameters can be edited by clicking on the 'Edit' button (green rectangle in the picture below). The 'Edit Parameters' dialog box will be displayed with a table of all adjustable parameters for this equation. These changes can be stored on disk (under .par extension) for further use, just by clicking on the 'Save' button (blue rectangle in the picture below).
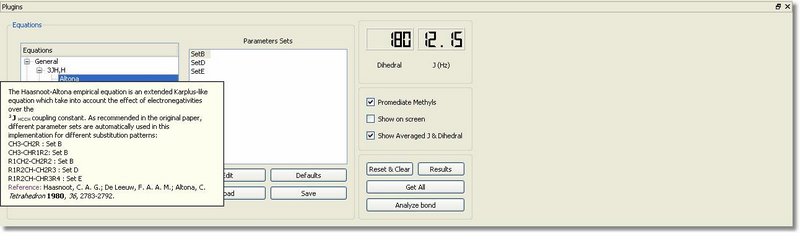
Right clicking on the equation name will show a brief description of the equations and also the hyperlinks of the references:
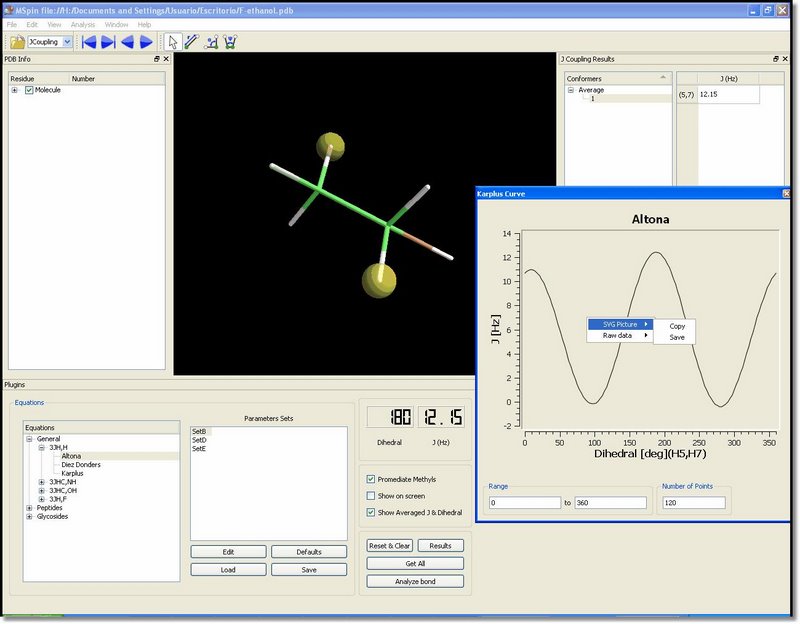
If two coupled nuclei are selected the whole Karplus curve around the correspondent dihedral angle may be represented by clicking on the “Analyze bond†button. The represented curve may be exported as a vector drawing (SVG), for further modification and publishing. Besides, the data points can be exported to spreadsheet programs.
