Note: Do not forget to have a look at our 1H NMR Automatic Assignments Tutorial
Mnova provides a very simple interface to assign your molecule. Open your NMR spectrum and load a molecule structure. Then follow the menu 'Analysis/Assignment' (or use the shortcut 'A').
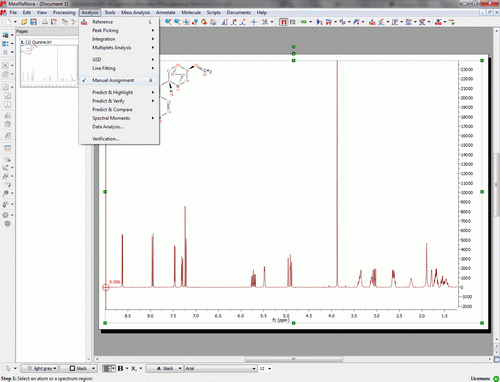
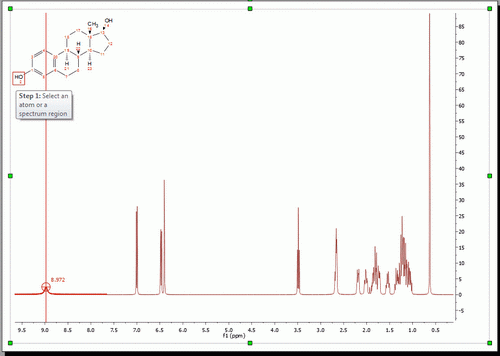
Click on an atom on the molecular structure (or a spectrum region) and then release the mouse and drag it to your desired peak. Once your desired peak is highlighted on the spectrum, click on it to assign it.
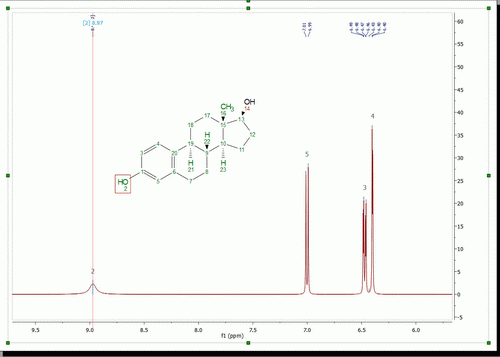
This peak will now be assigned to the atom (which will turn to green). Once the assignment has been made, you will get an atom number label on the chemical shift and hovering the mouse over the atom will highlight the applicable peak in the spectrum and hovering the mouse over the peak will highlight the corresponding atom on the molecular structure.
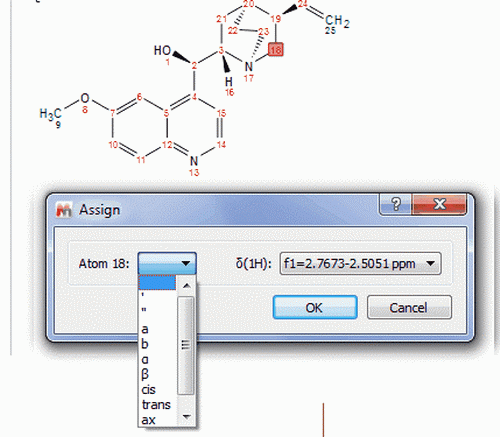
You can also assign a region of the spectrum just by clicking, dragging and releasing the mouse over the desired region. In the example below, we have assigned a -CH2 group, so a new window will be displayed to allow us to select which atom we want to assign, 18, 18', both (in blank) or even we can select any other annotation: 18a, 18b, cis/trans, ax/eq, etc:
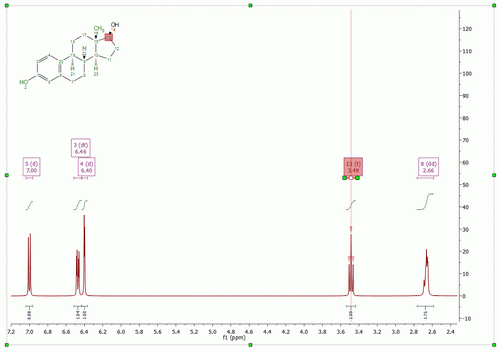
Assign a multiplet by dragging the mouse to the 'multiplet box' (in this case the name of the multiplet is replaced with the atom number) or to the 'integral curve', as you can see in the picture below:
We recommend you to assign your atoms to your multiplet boxes in order to transfer assignments through datasets. you can also assign a 13C-NMR of the same molecule in the same document. To do that, select the atoms from the Table of molecules by following the menu 'View/Tables/Molecules'. In order to keep the assignments propagation, follow the menu 'View/Tables/Assignments' to select what datasets you want to take into account (in the example below, we have selected the 1H and the 13C NMR datasets).

Assignments to 2D spectra:
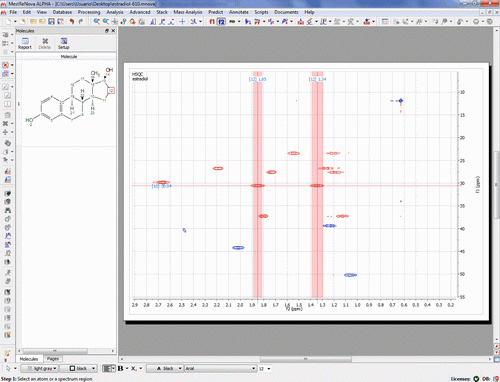
Once you have assigned the 1H and the 13C spectra, if you open in the same document a 2D-NMR spectrum and you link the spectra (from the Assignments table), you will see the assignments graphically on the screen and hovering the mouse over the atom will highlight the applicable chemical shift. In the example below, you can see the correlation between the two hydrogens and the carbon of the position 12 in a HSQC:
Also you can carry out assignments to 2D spectra by typing the applicable number of the atom in the 'Assignments Table' or graphically by selecting the atom in the molecule structure and the corresponding signal in the 2D:
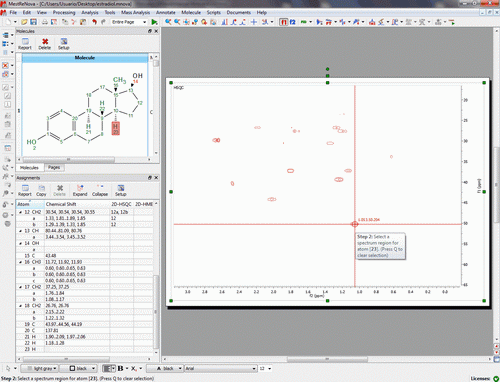
Click on the 2D spectra and a new window will be displayed to select the atoms are involved. (in that case, you will only need to select the atom 10 in f1):

Finally click OK and hover the mouse over the atom 23 to see the result (please notice how the assignment table has been automatically filled with the number '10' in the HSQC column, in order to show the correlation between the C-10 and the H-23).
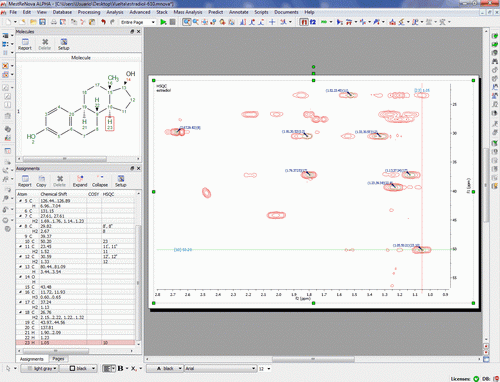
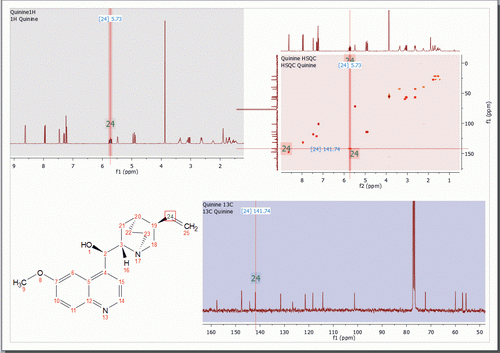
Copying several datasets on the same page is also available. Here you can see a page which contains a 1H, 13C and HSQC datasets with an assignment in the molecular structure:
