
-
2D assignment and assignments carried through to other relevant experiments
- It is now possible within Mnova to carry out atom to peak assignments both to 1D and 2D spectra. The assignment made in 1D will be carried through to other relevant experiments (2D for example).

GSD (Global Spectral Deconvolution) has been greatly improved
- GSD has been greatly improved including automatic detection of solvent peaks and characterization of specific proton signals as corresponding to labile protons

Group Delay
- Improved algorithm to process Bruker digitally filtered spectra in order to get rid of the so-called ‘smiles’ at both edges of the spectral width

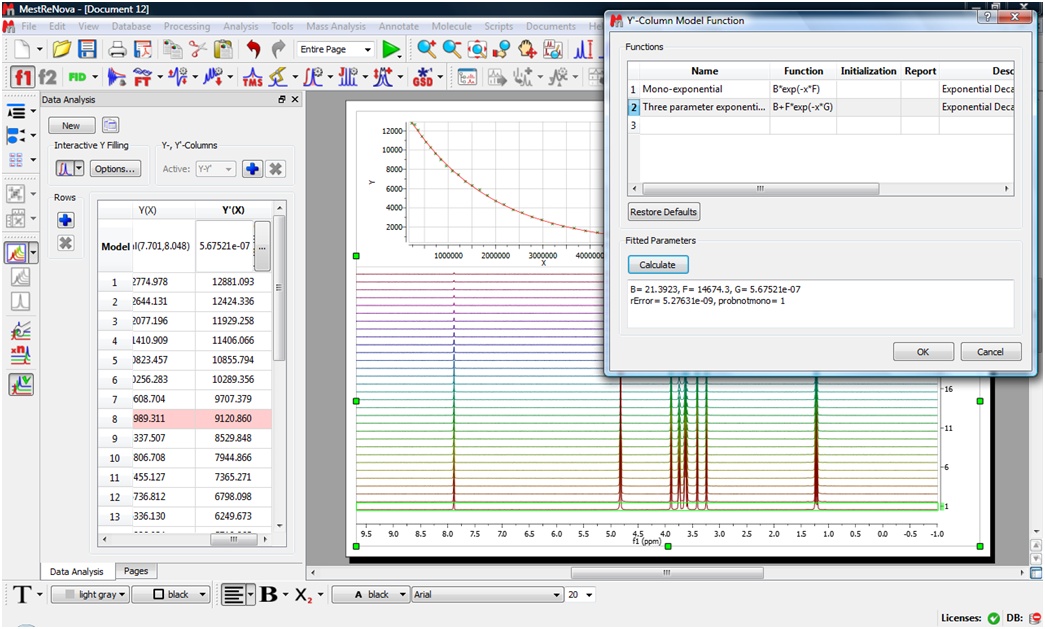
Data Analysis has been greatly improved
- Rows corresponding to spectra which have been removed from document (after the graph has been created) are marked with red background color.
- Added ability to change names and values of the fitting parameters. (new column “Report” in Y’-Column Model Function Dialog).
- Set of additional mathematical functions (log, tan, abs, etc.) are now available in the formula parser of this dialog
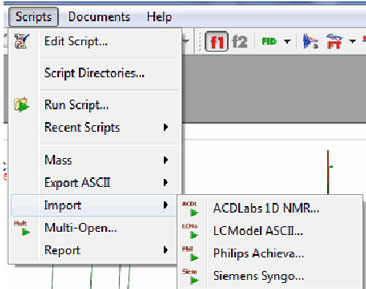
Importing of new spectral formats (ACD Labs, LC Model ASCII, Philips Achieva, Siemens Syngo) via scripting
- It is possible to import new spectral formats by using the scripting engine.
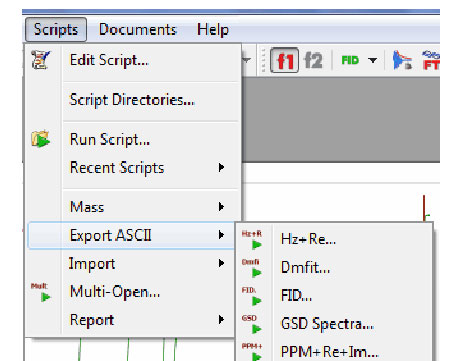
Exporting of spectra in different ASCII formats (Hz+Real, DmFit, FID, GSD Spectra, PPM+Real+Imaginary, etc) via scripting
- It is possible to export NMR spectra in different ASCII formats just by following the menu ‘Scripts/Export ASCII’.
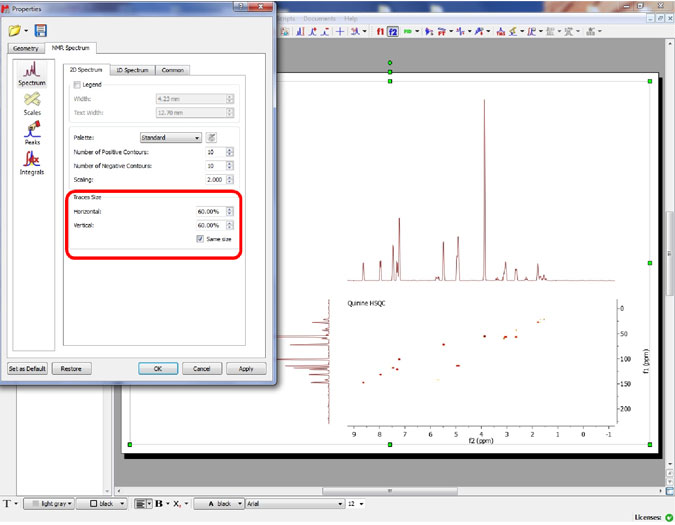
Capability to change the size of the traces of a 2D NMR spectrum
- It is possible to customize the size of the traces from the Properties dialog box
Capability to cut off peaks to avoid overlapping in stacked spectra
- It is possible to clip vertically the traces of a stacked plot from the Properties dialog box

Customization of the pen width of the integral curves
- The user is able to change the width of the integral curves from the Integral Properties dialog box

Ability to automatically open .zip files obtained from Bruker Topspin
Bugs Fixed
- Problems cutting stacked and overlaid spectra
- Problems opening NMR files from JEOL GX 400
- Problems working with overlaid 2D spectra with different scale ranges
- Crash while processing some DOSY experiments with Data Analysis
- Problems when panning to the end of the scale in a NMR spectrum with cuts
- Problems phasing some 13C-NMR spectra (with huge values of PH0 and PH1)
- Problems sorting the GSD Peaks table by Type or Flag
- Reference peak label was deleted after manual threshold peak picking
- Duplicated peak labels were obtained after a manual threshold and automatic peak picking
- Several labels appeared for the same chemical shift in case of magnetic equivalence in the Spin Simulation feature
- Problems reading gradient strength list in JEOL files
- Problems opening spectra in the correct order by using the multiopen script
- Problems opening .zip files not created in Windows (since Mnova 5.3.1)
- Problems with the annotations after having saved the document with a zoom-in
- Problems displaying the peak labels of a 2D spectrum after having cut some regions
- In the scripting engine: Integral.rangeMax() gave smaller value than rangeMin()
- X axis in Data Analysis graphic showed repeated values
- Problems double clicking to open Multiplet Manager in Manual Multiplet mode
- Some column labels of a previously customized GSD table didn’t match their contents
-
New Features
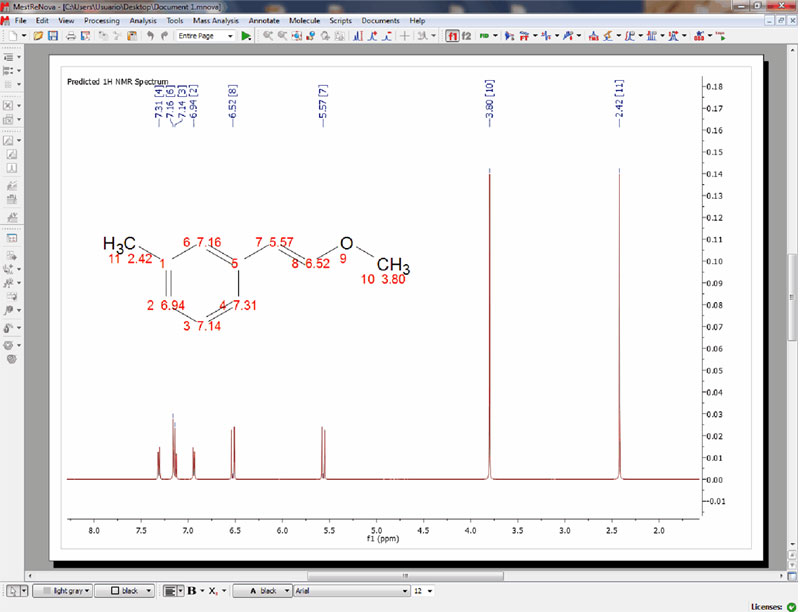
New improved version of NMRPredict Desktop: NMR Predictions are now faster, more stable and accurate
Bugs fixed
- Problems predicting the carbon chemical shift of imine groups
- Problems predicting the spectra of Boron compounds
- Problems predicting the NMR spectra of polideuterated compounds
- Crash when running predictions of some allenes
-
New Features
Capability to import additional LC/GC/MS formats (MassHunter, Iontrap, JEOL MSQ1000, SCIEX Analyst)
- Mnova MS is able to import additional formats
Chromatographic Manual Peak Detection/Integration
- It is possible to manually integrate the desired peaks of your TIC chromatogram.

Ability to change the order (up and down) of different plots (chromatogram and mass spectra)
- It is possible to freely move up and down the plots just by right clicking on them and selecting the desired option (Move Plot Top, Up, Down or Bottom)

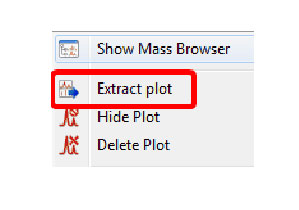
Ability to extract a chromatogram (TIC) or MS spectrum to a new page
- It is possible to extract the active plot to a new page from the context menu or from the toolbars
Possibility to show the polarity in TIC and mass spectrum header
- The user is able to add the polarity in the headers by using the ‘Title Macro Editor’

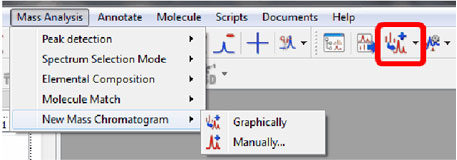
New button in the toolbar to open a mass chromatogram graphically and manually
- A new button in the toolbar allows the user to generate a mass chromatogram for a given mass range selected directly on the spectrum or by entering m/s range in a dialog box
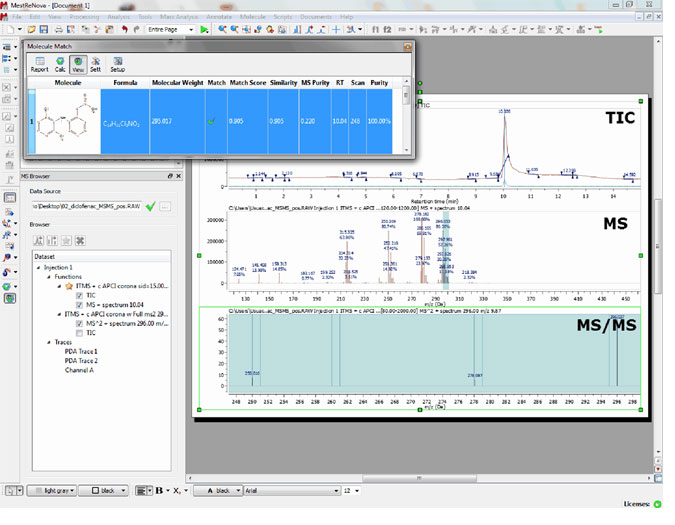
Capability to apply ‘Molecular Match’ with MS/MS spectra
- It is possible to run a Molecular Match with a MS/MS spectrum and see the result directly in the MS/MS.
New toolbar in Mnova MS to extract plots and open new chromatograms
- A new toolbar will allow the Mnova MS users to extract plots and open chromatograms quickly
Ability to show the Precursor m/z on MS/MS spectra
- The user is able to add the precursor on MS/MS spectra in the headers by using the ‘Title Macro Editor’

Capability to show integral of each peak as the percentage of all integrated peaks
- The user will be able to show Purity of the peaks, which will show the integral of each peak as the percentage of all integrated peak

Bugs Fixed
- Problems when opening big files from Bruker Daltonics
- Elemental composition calculation in ESI gives only whole numbers for DBE
- Show page title in the Mass datasets
-
New Features
Capability to edit the atom labels of the molecular structures
- It is possible to customize the appearance of all the atom labels of the molecule in order to add information about ‘annotations’, ‘assignments’, ‘predicted chemical shift’, etc.
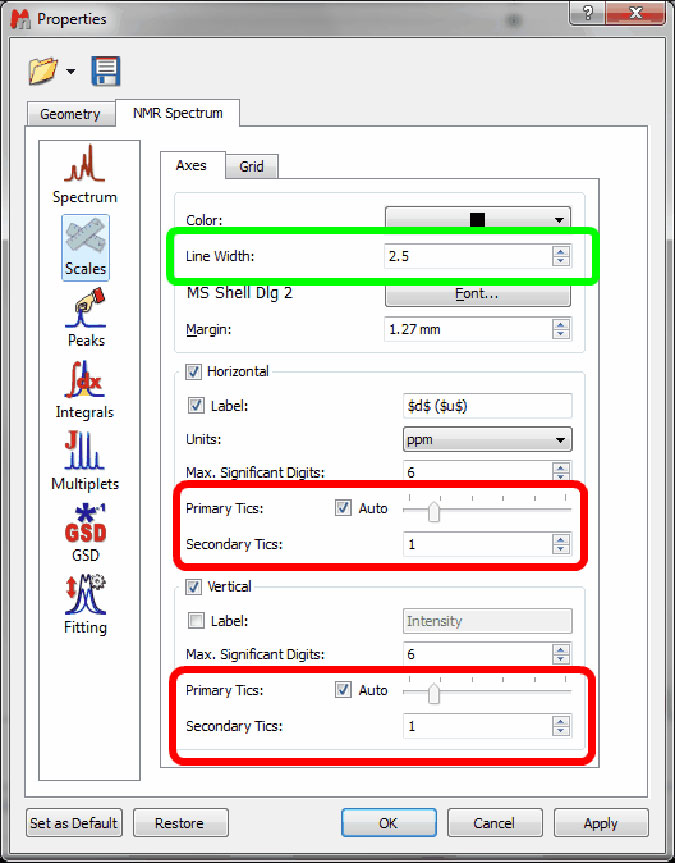
Ability to select the pen width and the number of tics in scales
- It will be possible to change the pen width and the number of Primary and Secondary tics of the scales.
Bugs fixed
- Crash changing the view in the zoom-combo box after having deleted all the pages in the document
What’s new in Mnova 6.1.0
0
Share.
